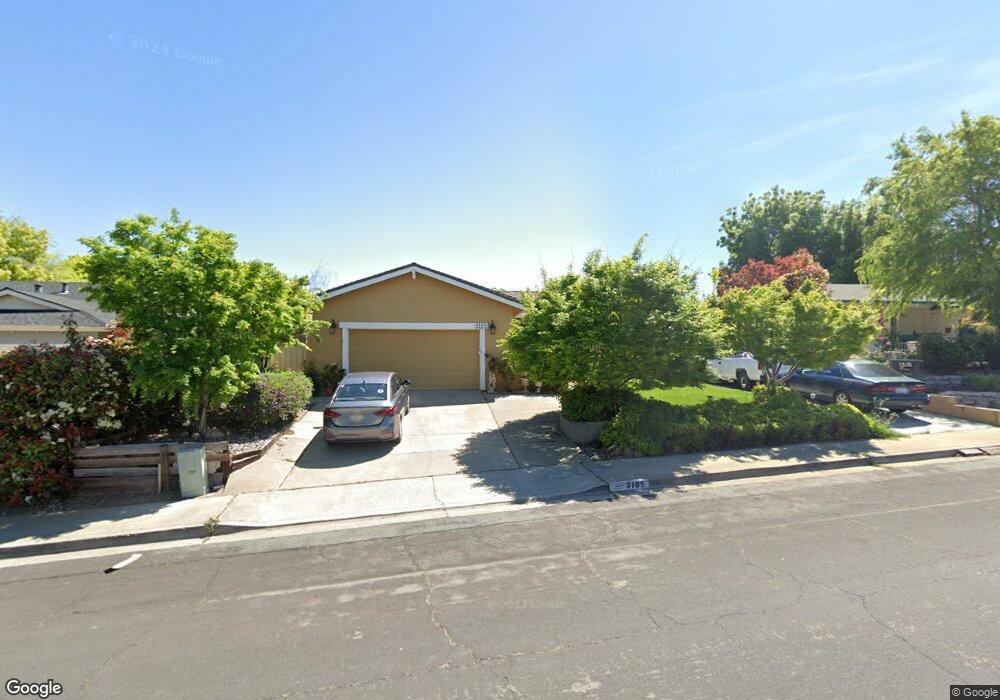
3105 S Francisco Way Antioch, CA 94509
Contra Loma NeighborhoodEstimated Value: $580,616 - $635,000
4
Beds
2
Baths
1,696
Sq Ft
$352/Sq Ft
Est. Value
About This Home
This home is located at 3105 S Francisco Way, Antioch, CA 94509 and is currently estimated at $596,904, approximately $351 per square foot. 3105 S Francisco Way is a home located in Contra Costa County with nearby schools including Sutter Elementary School, Park Middle School, and Antioch High School.
Ownership History
Date
Name
Owned For
Owner Type
Purchase Details
Closed on
Mar 21, 2012
Sold by
Romarco #2 Lp
Bought by
Abina Domingo G and Abina Ginalyn B
Current Estimated Value
Home Financials for this Owner
Home Financials are based on the most recent Mortgage that was taken out on this home.
Original Mortgage
$168,000
Outstanding Balance
$115,349
Interest Rate
3.86%
Mortgage Type
New Conventional
Estimated Equity
$481,555
Purchase Details
Closed on
Dec 5, 2011
Sold by
Evans M Yvette and Evans Brian A
Bought by
Romarco #2 Lp
Purchase Details
Closed on
Nov 7, 2000
Sold by
Scott Lauer Paul and Scott Loretta
Bought by
Evans Brian A and Yvette Evans M
Home Financials for this Owner
Home Financials are based on the most recent Mortgage that was taken out on this home.
Original Mortgage
$217,545
Interest Rate
7.88%
Mortgage Type
FHA
Create a Home Valuation Report for This Property
The Home Valuation Report is an in-depth analysis detailing your home's value as well as a comparison with similar homes in the area
Home Values in the Area
Average Home Value in this Area
Purchase History
| Date | Buyer | Sale Price | Title Company |
|---|---|---|---|
| Abina Domingo G | $210,000 | Fidelity National Title Co | |
| Romarco #2 Lp | $141,800 | None Available | |
| Evans Brian A | $219,000 | First American Title Guarant |
Source: Public Records
Mortgage History
| Date | Status | Borrower | Loan Amount |
|---|---|---|---|
| Open | Abina Domingo G | $168,000 | |
| Previous Owner | Evans Brian A | $217,545 |
Source: Public Records
Tax History Compared to Growth
Tax History
| Year | Tax Paid | Tax Assessment Tax Assessment Total Assessment is a certain percentage of the fair market value that is determined by local assessors to be the total taxable value of land and additions on the property. | Land | Improvement |
|---|---|---|---|---|
| 2025 | $3,429 | $263,760 | $62,796 | $200,964 |
| 2024 | $3,337 | $258,589 | $61,565 | $197,024 |
| 2023 | $3,337 | $253,519 | $60,358 | $193,161 |
| 2022 | $3,288 | $248,549 | $59,175 | $189,374 |
| 2021 | $3,159 | $243,676 | $58,015 | $185,661 |
| 2019 | $3,113 | $236,451 | $56,296 | $180,155 |
| 2018 | $3,004 | $231,816 | $55,193 | $176,623 |
| 2017 | $2,926 | $227,271 | $54,111 | $173,160 |
| 2016 | $2,856 | $222,815 | $53,050 | $169,765 |
| 2015 | $2,827 | $219,469 | $52,254 | $167,215 |
| 2014 | $2,743 | $215,171 | $51,231 | $163,940 |
Source: Public Records
Map
Nearby Homes
- 1618 Putnam St
- 3163 S Francisco Way
- 3026 El Monte Ct
- 3019 El Monte Ct
- 2225 Sherman Ct
- 2208 Hamlin Dr
- 3301 Saint James Place
- 2217 Hamlin Dr
- 3326 Hacienda Way
- 1205 Putnam St
- 2320 Meredith Way
- 2924 Ventura Ct
- 2928 El Monte Way
- 2948 Palo Verde Way
- 2125 Robles Dr
- 2921 Lucena Way
- 3366 S Francisco Way
- 2205 Robles Dr
- 2005 Cerro Ct
- 3224 Madrone St
- 3109 S Francisco Way
- 3101 S Francisco Way
- 3106 Ponderosa Way
- 3110 Ponderosa Way
- 3100 Ponderosa Way
- 3113 S Francisco Way
- 3114 Ponderosa Way
- 3106 S Francisco Way
- 3100 S Francisco Way
- 3110 S Francisco Way
- 3117 S Francisco Way
- 3118 Ponderosa Way
- 3114 S Francisco Way
- 1500 Putnam St
- 1506 Putnam St
- 1408 Putnam St
- 3105 Ponderosa Way
- 3109 Ponderosa Way
- 3101 Ponderosa Way
- 3121 S Francisco Way