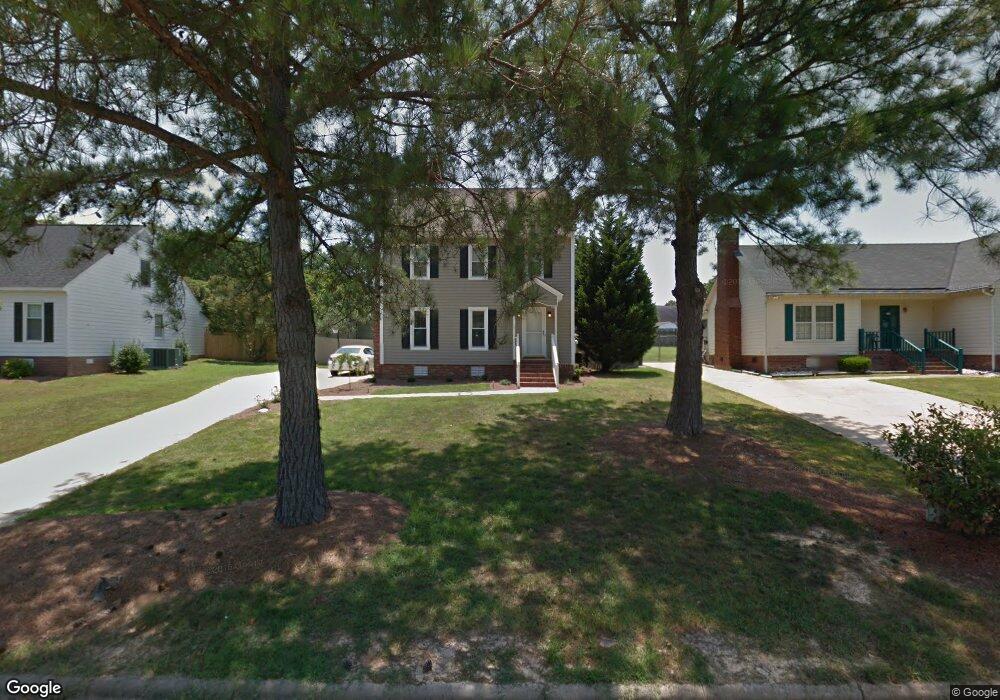
3106 Fieldstream Dr N Wilson, NC 27896
Estimated Value: $185,000 - $225,000
3
Beds
3
Baths
1,372
Sq Ft
$153/Sq Ft
Est. Value
About This Home
This home is located at 3106 Fieldstream Dr N, Wilson, NC 27896 and is currently estimated at $209,942, approximately $153 per square foot. 3106 Fieldstream Dr N is a home located in Wilson County with nearby schools including Wells Elementary School, Toisnot Middle School, and Fike High School.
Ownership History
Date
Name
Owned For
Owner Type
Purchase Details
Closed on
Jul 25, 2024
Sold by
Michael Tyson James and Webb Amanda
Bought by
Shakedown Llc
Current Estimated Value
Purchase Details
Closed on
Nov 23, 2011
Sold by
Watson Ronald R and Watson Louise B
Bought by
Tyson James Michael and Tyson Amanda Webb
Home Financials for this Owner
Home Financials are based on the most recent Mortgage that was taken out on this home.
Original Mortgage
$115,493
Interest Rate
3.75%
Mortgage Type
FHA
Purchase Details
Closed on
May 13, 2011
Sold by
Watson Ronald
Bought by
Watson Ronald R and Watson Louise B
Purchase Details
Closed on
Apr 19, 2011
Sold by
Federal National Mortgage Association
Bought by
Watson Ronald
Purchase Details
Closed on
Sep 27, 2010
Sold by
Davis James William and Davis Lisa B
Bought by
Federal National Mortgage Association and Fannie Mae
Create a Home Valuation Report for This Property
The Home Valuation Report is an in-depth analysis detailing your home's value as well as a comparison with similar homes in the area
Home Values in the Area
Average Home Value in this Area
Purchase History
| Date | Buyer | Sale Price | Title Company |
|---|---|---|---|
| Shakedown Llc | $175,000 | None Listed On Document | |
| Shakedown Llc | $175,000 | None Listed On Document | |
| Tyson James Michael | $118,500 | -- | |
| Watson Ronald R | -- | -- | |
| Watson Ronald | -- | -- | |
| Federal National Mortgage Association | -- | None Available |
Source: Public Records
Mortgage History
| Date | Status | Borrower | Loan Amount |
|---|---|---|---|
| Previous Owner | Tyson James Michael | $115,493 |
Source: Public Records
Tax History Compared to Growth
Tax History
| Year | Tax Paid | Tax Assessment Tax Assessment Total Assessment is a certain percentage of the fair market value that is determined by local assessors to be the total taxable value of land and additions on the property. | Land | Improvement |
|---|---|---|---|---|
| 2025 | $1,470 | $200,834 | $45,000 | $155,834 |
| 2024 | $1,470 | $200,834 | $45,000 | $155,834 |
| 2023 | $1,385 | $106,145 | $25,000 | $81,145 |
| 2022 | $1,385 | $106,145 | $25,000 | $81,145 |
| 2021 | $1,385 | $106,145 | $25,000 | $81,145 |
| 2020 | $1,385 | $106,145 | $25,000 | $81,145 |
| 2019 | $1,385 | $106,145 | $25,000 | $81,145 |
| 2018 | $0 | $106,145 | $25,000 | $81,145 |
| 2017 | $1,364 | $106,145 | $25,000 | $81,145 |
| 2016 | $1,364 | $106,145 | $25,000 | $81,145 |
| 2014 | $1,342 | $107,795 | $25,000 | $82,795 |
Source: Public Records
Map
Nearby Homes
- 2811 Deerfield Ln N
- 3217 Fieldstream Dr N
- 3202 Walbrook Place N
- 2906 Brentwood Dr N
- 3311 Westshire Dr
- 3806 Wyattwood Dr N
- 3702 Arrowwood Dr N
- 2803 Ardsley Rd N
- 3530 Shadow Ridge Rd N
- 2400 Bradford Dr N Unit 7b
- 3645 Eagle Farm Dr N
- 3704 Shadow Ridge Rd N
- 2560 Pond Dr N
- 2402 Bradford Dr N Unit 10A
- 3902 Redbay Ln
- 2323 Alyson Dr N
- 2214 Nash Place N
- 2917 Ward Blvd
- 2929 Ward Blvd
- 2311 Alyson Dr N
- 3104 Fieldstream Dr N
- 3200 Fieldstream Dr N
- 3003 Kings Mill Walk N
- 3005 Kings Mill Walk N
- 3202 Fieldstream Dr N
- 3101 Plum Dr N
- 3008 Brentwood Dr N
- 3100 Plum Dr N
- 3100 Fieldstream Dr N
- 3006 Brentwood Dr N
- 3204 Fieldstream Dr N
- 3103 Plum Dr N
- 3007 Kings Mill Walk N
- 3102 Plum Dr N
- 3103 Fieldstream Dr N
- 3203 Fieldstream Dr N
- 3206 Fieldstream Dr N
- 3101 Fieldstream Dr N
- 3018 Fieldstream Dr N
- 3004 Kings Mill Walk N