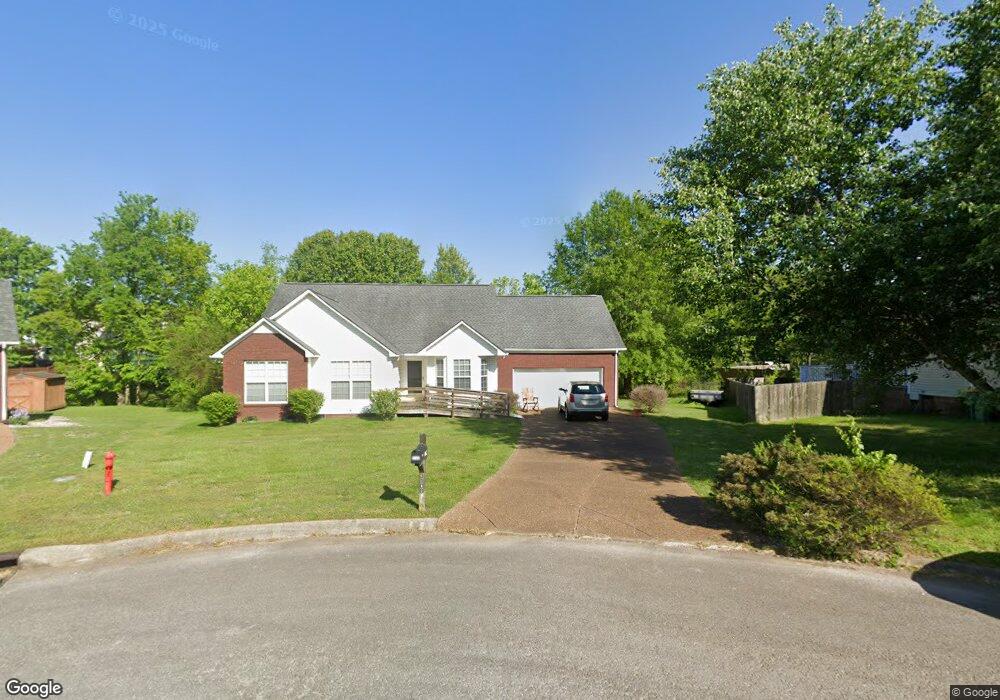
3106 Jeffrey Ct Thompsons Station, TN 37179
Estimated Value: $412,946 - $479,000
--
Bed
3
Baths
1,666
Sq Ft
$264/Sq Ft
Est. Value
About This Home
This home is located at 3106 Jeffrey Ct, Thompsons Station, TN 37179 and is currently estimated at $439,237, approximately $263 per square foot. 3106 Jeffrey Ct is a home located in Williamson County with nearby schools including Spring Station Middle School, Summit High School, and Primrose School of Spring Hill.
Ownership History
Date
Name
Owned For
Owner Type
Purchase Details
Closed on
Aug 7, 2002
Sold by
Davenport Properties Inc
Bought by
Dilling Arthur D
Current Estimated Value
Home Financials for this Owner
Home Financials are based on the most recent Mortgage that was taken out on this home.
Original Mortgage
$134,000
Outstanding Balance
$56,578
Interest Rate
6.79%
Estimated Equity
$382,659
Purchase Details
Closed on
Jul 2, 2002
Sold by
Webb Christopher Michael and Webb Jamie Joelle
Bought by
Davenport Properties Inc
Home Financials for this Owner
Home Financials are based on the most recent Mortgage that was taken out on this home.
Original Mortgage
$134,000
Outstanding Balance
$56,578
Interest Rate
6.79%
Estimated Equity
$382,659
Purchase Details
Closed on
Dec 15, 2000
Sold by
Golden Taylor R
Bought by
Webb Christopher Michael and Webb Jamie Joelle
Home Financials for this Owner
Home Financials are based on the most recent Mortgage that was taken out on this home.
Original Mortgage
$132,905
Interest Rate
7.81%
Create a Home Valuation Report for This Property
The Home Valuation Report is an in-depth analysis detailing your home's value as well as a comparison with similar homes in the area
Home Values in the Area
Average Home Value in this Area
Purchase History
| Date | Buyer | Sale Price | Title Company |
|---|---|---|---|
| Dilling Arthur D | $142,000 | -- | |
| Davenport Properties Inc | $134,000 | Mid State Title & Escrow Inc | |
| Webb Christopher Michael | $139,900 | -- |
Source: Public Records
Mortgage History
| Date | Status | Borrower | Loan Amount |
|---|---|---|---|
| Open | Davenport Properties Inc | $134,000 | |
| Previous Owner | Webb Christopher Michael | $132,905 |
Source: Public Records
Tax History Compared to Growth
Tax History
| Year | Tax Paid | Tax Assessment Tax Assessment Total Assessment is a certain percentage of the fair market value that is determined by local assessors to be the total taxable value of land and additions on the property. | Land | Improvement |
|---|---|---|---|---|
| 2025 | $555 | $110,075 | $32,500 | $77,575 |
| 2024 | $555 | $75,050 | $16,250 | $58,800 |
| 2023 | $555 | $75,050 | $16,250 | $58,800 |
| 2022 | $1,373 | $75,050 | $16,250 | $58,800 |
| 2021 | $1,373 | $75,050 | $16,250 | $58,800 |
| 2020 | $1,136 | $52,575 | $11,250 | $41,325 |
| 2019 | $1,136 | $52,575 | $11,250 | $41,325 |
| 2018 | $1,099 | $52,575 | $11,250 | $41,325 |
| 2017 | $1,088 | $52,575 | $11,250 | $41,325 |
| 2016 | $0 | $52,575 | $11,250 | $41,325 |
| 2015 | -- | $39,950 | $10,000 | $29,950 |
| 2014 | -- | $39,950 | $10,000 | $29,950 |
Source: Public Records
Map
Nearby Homes
- 2812 Curacao Ln
- 2808 Lafayette Dr
- 2821 Lafayette Dr
- 102 Cardiff Dr N
- 1023 Fitzroy Cir
- 114 Mitford Ln
- 2517 Tisdale Dr
- Hollis 1C Plan at Saddlewalk at June Lake - Belmont
- Harrow 1B Plan at Saddlewalk at June Lake - Derby
- Hayes 1B Plan at Saddlewalk at June Lake - Belmont
- Hollis 1B Plan at Saddlewalk at June Lake - Belmont
- Fielding 1B Plan at Saddlewalk at June Lake - Belmont
- Fielding 1C Plan at Saddlewalk at June Lake - Belmont
- Lochlan 1B Plan at Saddlewalk at June Lake - Derby
- Cantor Executive 4A Plan at Saddlewalk at June Lake - Belmont
- Cantor Executive 4B Plan at Saddlewalk at June Lake - Belmont
- Bay 1A Plan at Saddlewalk at June Lake - Derby
- Fielding 1A Plan at Saddlewalk at June Lake - Belmont
- Lochlan 1D Plan at Saddlewalk at June Lake - Derby
- Signature Gale 2B Plan at Saddlewalk at June Lake - Signature