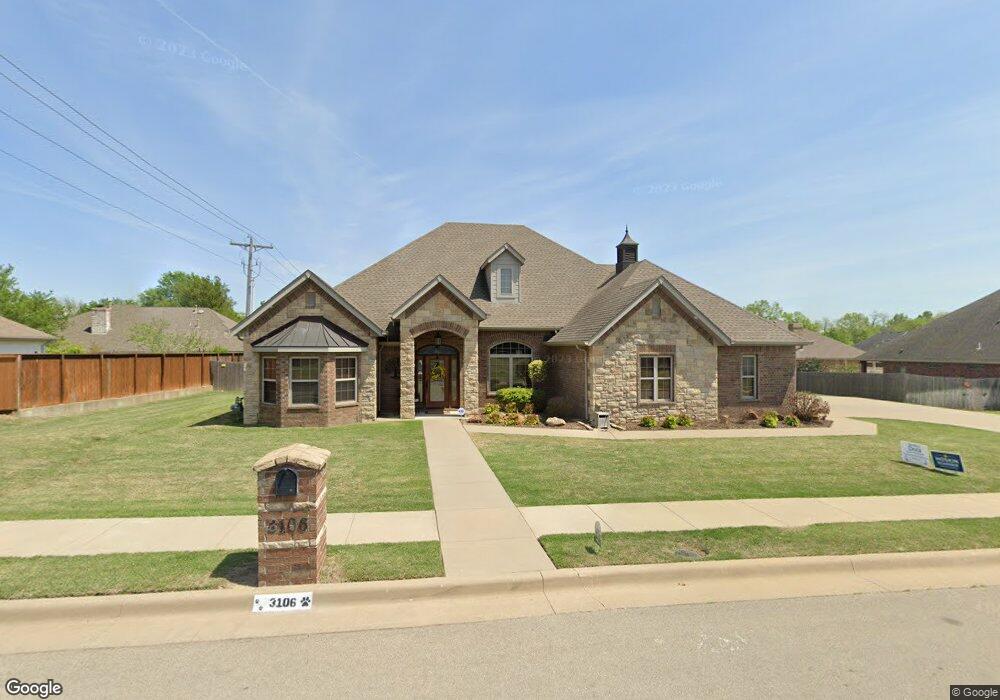
3106 Kingston Dr Bartlesville, OK 74006
Estimated Value: $449,000 - $474,269
4
Beds
3
Baths
3,125
Sq Ft
$148/Sq Ft
Est. Value
About This Home
This home is located at 3106 Kingston Dr, Bartlesville, OK 74006 and is currently estimated at $462,067, approximately $147 per square foot. 3106 Kingston Dr is a home located in Washington County with nearby schools including Wayside Elementary School, Central Middle School, and Bartlesville High School.
Ownership History
Date
Name
Owned For
Owner Type
Purchase Details
Closed on
Feb 11, 2016
Sold by
Holland Janice S and Spurgeon Janice S Holland
Bought by
Holland Janice S
Current Estimated Value
Purchase Details
Closed on
Jul 2, 2014
Sold by
Holland Fred and Holland Janice S Holland~Spu
Bought by
Holland Janice S
Purchase Details
Closed on
Feb 17, 2011
Sold by
Brent Taylor Homes Inc
Bought by
Holland Fred and Spurgeon Janice S Holland
Purchase Details
Closed on
Sep 21, 2010
Sold by
Taylor Kimrey Llc
Bought by
Brenttaylor Homes Inc
Home Financials for this Owner
Home Financials are based on the most recent Mortgage that was taken out on this home.
Original Mortgage
$262,500
Interest Rate
4.42%
Mortgage Type
Construction
Purchase Details
Closed on
Jul 4, 1776
Sold by
Rice Creek Develelopment Company Ll
Create a Home Valuation Report for This Property
The Home Valuation Report is an in-depth analysis detailing your home's value as well as a comparison with similar homes in the area
Home Values in the Area
Average Home Value in this Area
Purchase History
| Date | Buyer | Sale Price | Title Company |
|---|---|---|---|
| Holland Janice S | -- | None Available | |
| Holland Janice S | -- | -- | |
| Holland Fred | $353,000 | -- | |
| Brenttaylor Homes Inc | $50,000 | -- | |
| -- | -- | -- |
Source: Public Records
Mortgage History
| Date | Status | Borrower | Loan Amount |
|---|---|---|---|
| Previous Owner | Brenttaylor Homes Inc | $262,500 |
Source: Public Records
Tax History Compared to Growth
Tax History
| Year | Tax Paid | Tax Assessment Tax Assessment Total Assessment is a certain percentage of the fair market value that is determined by local assessors to be the total taxable value of land and additions on the property. | Land | Improvement |
|---|---|---|---|---|
| 2025 | $5,446 | $47,742 | $6,000 | $41,742 |
| 2024 | $5,446 | $46,351 | $6,000 | $40,351 |
| 2023 | $5,446 | $46,351 | $6,000 | $40,351 |
| 2022 | $5,393 | $46,351 | $6,000 | $40,351 |
| 2021 | $5,131 | $44,683 | $6,000 | $38,683 |
| 2020 | $5,089 | $43,381 | $6,000 | $37,381 |
| 2019 | $5,091 | $43,381 | $6,000 | $37,381 |
| 2018 | $5,066 | $43,381 | $6,000 | $37,381 |
| 2017 | $5,184 | $43,381 | $6,000 | $37,381 |
| 2016 | $4,761 | $42,468 | $6,000 | $36,468 |
| 2015 | $4,835 | $42,468 | $6,000 | $36,468 |
| 2014 | $4,934 | $42,468 | $6,000 | $36,468 |
Source: Public Records
Map
Nearby Homes
- 2925 Claremont Dr
- 2740 Montrose Dr
- 2816 Roanoke Ridge Rd
- 2801 Monticello Dr
- 3201 Brighton Ln
- 2708 Claremont Dr
- 2549 Regency Rd
- 2601 Rice Creek Rd
- 2527 Dorchester Dr
- 2516 Williamsburg St
- 0000 Highway 75
- 2809 Kingston Ct
- 2408 Chapel Hill Ct
- 2410 Dorchester Dr
- 4105 Starboard Ct
- 0 SE Price Rd Unit 2531102
- 3200 Price Rd Unit 33
- 39 SE Shadow Lake Unit 39
- 2 Blackstone Ct
- 1 Blackstone Ct
- 327 Emery Ln
- 3107 Montrose Dr
- 3107 Montrose Dr
- 3110 Kingston Dr
- 3016 Kingston Dr
- 3017 Montrose Dr
- 3111 Montrose Dr
- 3107 SE Kingston
- 3111 Montrose Dr
- 3111 Kingston Dr
- 3017 Kingston Dr
- 3114 Kingston Dr
- 3008 Kingston Dr
- 3114 Kingston Dr
- 3009 Montrose Dr
- 3106 Montrose Dr
- 3106 Claremont Dr
- 3115 Kingston Dr
- 3009 Kingston Dr
- 3110 Claremont Dr