3106 Myrtle Ave San Diego, CA 92104
North Park NeighborhoodEstimated Value: $998,177 - $1,305,000
2
Beds
1
Bath
1,130
Sq Ft
$1,011/Sq Ft
Est. Value
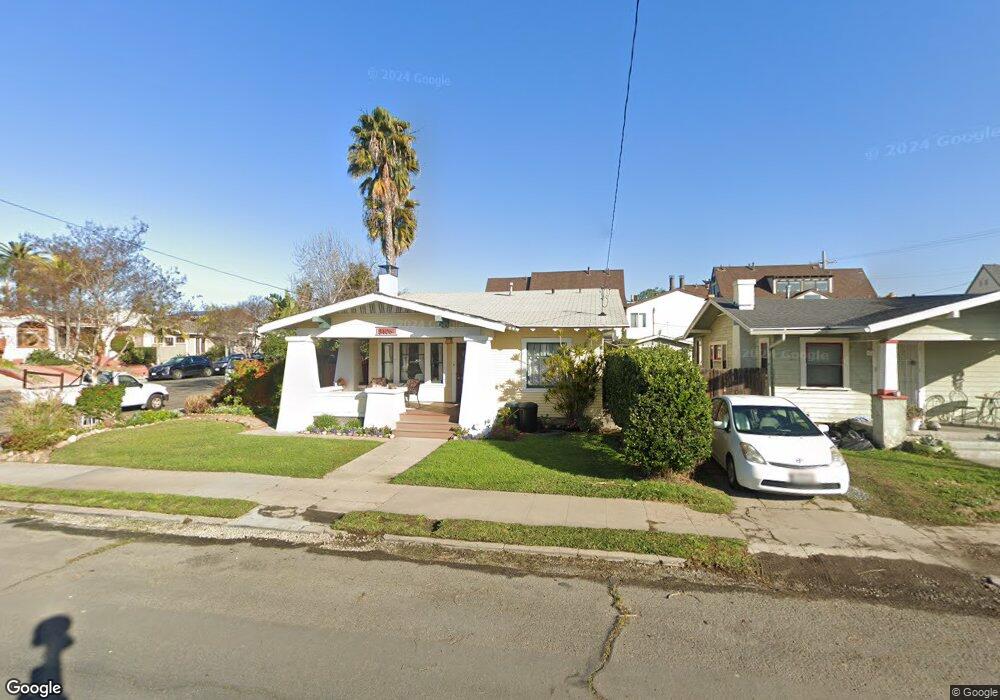
About This Home
This home is located at 3106 Myrtle Ave, San Diego, CA 92104 and is currently estimated at $1,142,044, approximately $1,010 per square foot. 3106 Myrtle Ave is a home located in San Diego County with nearby schools including McKinley Elementary School, Roosevelt International Middle School, and San Diego Global Vision Academy.
Ownership History
Date
Name
Owned For
Owner Type
Purchase Details
Closed on
May 8, 2025
Sold by
Noble Steven and Noble Carrie
Bought by
Steven And Carrie Noble Family Trust and Noble
Current Estimated Value
Purchase Details
Closed on
Feb 9, 2000
Sold by
Mendez Ralph Murrieta and Mendez Aida C
Bought by
Noble Steven and Noble Carrie
Home Financials for this Owner
Home Financials are based on the most recent Mortgage that was taken out on this home.
Original Mortgage
$188,000
Interest Rate
8.16%
Purchase Details
Closed on
Oct 5, 1999
Sold by
Jones Jean I
Bought by
Mendez Ralph Murrieta and Mendez Aida C
Home Financials for this Owner
Home Financials are based on the most recent Mortgage that was taken out on this home.
Original Mortgage
$132,200
Interest Rate
7.82%
Create a Home Valuation Report for This Property
The Home Valuation Report is an in-depth analysis detailing your home's value as well as a comparison with similar homes in the area
Home Values in the Area
Average Home Value in this Area
Purchase History
| Date | Buyer | Sale Price | Title Company |
|---|---|---|---|
| Steven And Carrie Noble Family Trust | -- | None Listed On Document | |
| Noble Steven | $235,000 | Commonwealth Land Title Co | |
| Mendez Ralph Murrieta | $157,500 | Commonwealth Land Title Co |
Source: Public Records
Mortgage History
| Date | Status | Borrower | Loan Amount |
|---|---|---|---|
| Previous Owner | Noble Steven | $188,000 | |
| Previous Owner | Mendez Ralph Murrieta | $132,200 |
Source: Public Records
Tax History Compared to Growth
Tax History
| Year | Tax Paid | Tax Assessment Tax Assessment Total Assessment is a certain percentage of the fair market value that is determined by local assessors to be the total taxable value of land and additions on the property. | Land | Improvement |
|---|---|---|---|---|
| 2025 | $4,329 | $361,160 | $300,977 | $60,183 |
| 2024 | $4,329 | $354,079 | $295,076 | $59,003 |
| 2023 | $4,231 | $347,138 | $289,291 | $57,847 |
| 2022 | $4,116 | $340,332 | $283,619 | $56,713 |
| 2021 | $4,085 | $333,659 | $278,058 | $55,601 |
| 2020 | $4,034 | $330,238 | $275,207 | $55,031 |
| 2019 | $3,961 | $323,763 | $269,811 | $53,952 |
| 2018 | $3,703 | $317,416 | $264,521 | $52,895 |
| 2017 | $3,614 | $311,193 | $259,335 | $51,858 |
| 2016 | $3,554 | $305,092 | $254,250 | $50,842 |
| 2015 | $3,500 | $300,510 | $250,431 | $50,079 |
| 2014 | $3,444 | $294,625 | $245,526 | $49,099 |
Source: Public Records
Map
Nearby Homes
- 3410 Grim Ave
- 3365-69 Grim Ave
- 3509-11 32nd St
- 0 35th St
- 3388 Bancroft St
- 3376 30th St
- 3209-13 31st St
- 3572 33rd St
- 3143-47 30th St
- 3167 Landis St
- 2931 Thorn St
- 3129 Redwood St
- 3739 31st St
- 3078 Quince St
- 3694 33rd St
- 3744 Grim Ave Unit 1
- 3644 29th St
- 0 Boundary St Unit SB25155904
- 3780 32nd St
- 3760 Grim Ave
- 3112 Myrtle Ave
- 3519 31st St Unit 4
- 3519 31st St Unit 3
- 3519 31st St Unit 2
- 3519 31st St Unit 1
- 3120 Myrtle Ave
- 3504 31st St
- 3527 31st St Unit 4
- 3527 31st St Unit 3
- 3527 31st St Unit 2
- 3527 31st St Unit 1
- 3117 Myrtle Ave
- 3512 31st St
- 3080 Myrtle Ave
- 3520 31st St
- 3512 Herman Ave Unit 4
- 3512 Herman Ave Unit 3
- 3512 Herman Ave
- 3535 31st St
- 3435 31st St