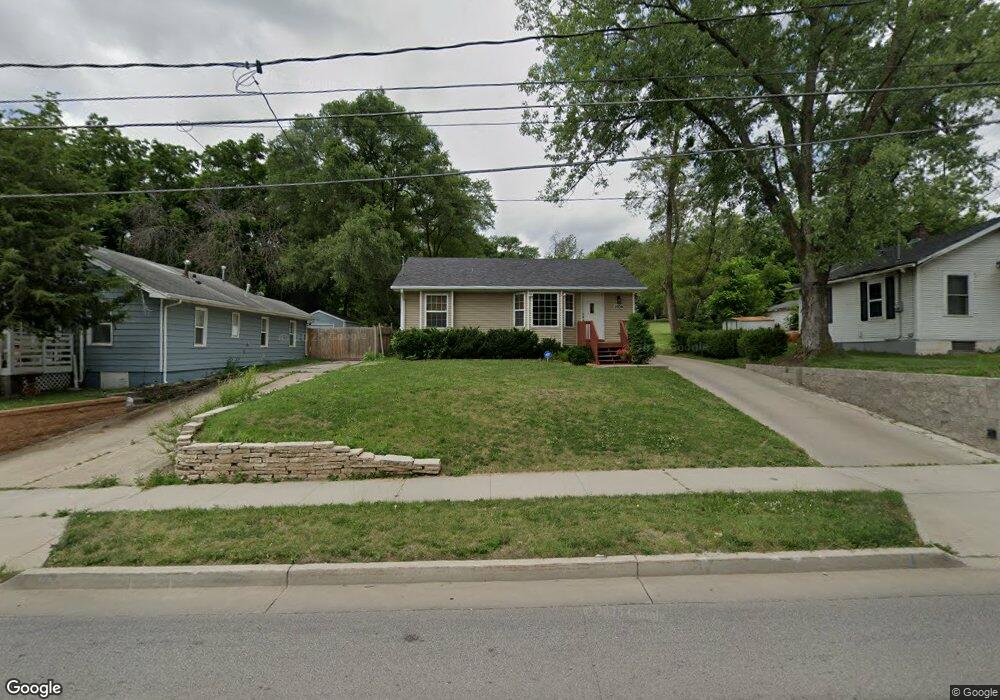
3106 South Union St Des Moines, IA 50315
Indianola Hills NeighborhoodEstimated Value: $231,000 - $266,000
3
Beds
3
Baths
1,094
Sq Ft
$226/Sq Ft
Est. Value
About This Home
This home is located at 3106 South Union St, Des Moines, IA 50315 and is currently estimated at $247,694, approximately $226 per square foot. 3106 South Union St is a home located in Polk County with nearby schools including Park Avenue Elementary School, Brody Middle School, and Lincoln High School.
Ownership History
Date
Name
Owned For
Owner Type
Purchase Details
Closed on
Aug 21, 2023
Sold by
Darling Misty and Darling Bradley J
Bought by
Mahal Shannen and Bettermann Tyler
Current Estimated Value
Home Financials for this Owner
Home Financials are based on the most recent Mortgage that was taken out on this home.
Original Mortgage
$37,500
Interest Rate
6.81%
Mortgage Type
New Conventional
Purchase Details
Closed on
May 9, 2023
Sold by
Stanton Timothy W
Bought by
Cross-Soldwisch Misty
Purchase Details
Closed on
Jun 11, 2007
Sold by
R M Madden Construction Inc
Bought by
Stanton Timothy W
Home Financials for this Owner
Home Financials are based on the most recent Mortgage that was taken out on this home.
Original Mortgage
$105,450
Interest Rate
6.2%
Mortgage Type
Purchase Money Mortgage
Purchase Details
Closed on
Oct 14, 2005
Sold by
Contract Finance Lc
Bought by
R M Madden Construction Inc
Purchase Details
Closed on
Sep 30, 2005
Sold by
Iowa Food Sales Co
Bought by
Contract Finance Lc
Purchase Details
Closed on
Feb 7, 1997
Sold by
Lynch Douglas D and Lynch Peggy J
Bought by
Contract Finance L C
Create a Home Valuation Report for This Property
The Home Valuation Report is an in-depth analysis detailing your home's value as well as a comparison with similar homes in the area
Home Values in the Area
Average Home Value in this Area
Purchase History
| Date | Buyer | Sale Price | Title Company |
|---|---|---|---|
| Mahal Shannen | $250,000 | None Listed On Document | |
| Cross-Soldwisch Misty | $190,500 | None Listed On Document | |
| Stanton Timothy W | $140,500 | None Available | |
| R M Madden Construction Inc | $12,500 | -- | |
| Contract Finance Lc | $18,000 | -- | |
| Contract Finance L C | -- | -- |
Source: Public Records
Mortgage History
| Date | Status | Borrower | Loan Amount |
|---|---|---|---|
| Closed | Mahal Shannen | $37,500 | |
| Open | Mahal Shannen | $200,000 | |
| Previous Owner | Stanton Timothy W | $105,450 | |
| Closed | Cross-Soldwisch Misty | $0 |
Source: Public Records
Tax History Compared to Growth
Tax History
| Year | Tax Paid | Tax Assessment Tax Assessment Total Assessment is a certain percentage of the fair market value that is determined by local assessors to be the total taxable value of land and additions on the property. | Land | Improvement |
|---|---|---|---|---|
| 2025 | $4,582 | $285,300 | $40,500 | $244,800 |
| 2024 | $4,582 | $232,900 | $35,600 | $197,300 |
| 2023 | $4,130 | $232,900 | $35,600 | $197,300 |
| 2022 | $4,096 | $184,100 | $29,300 | $154,800 |
| 2021 | $3,878 | $184,100 | $29,300 | $154,800 |
| 2020 | $4,024 | $164,000 | $26,100 | $137,900 |
| 2019 | $3,692 | $164,000 | $26,100 | $137,900 |
| 2018 | $3,650 | $145,900 | $22,700 | $123,200 |
| 2017 | $3,364 | $145,900 | $22,700 | $123,200 |
| 2016 | $3,272 | $132,900 | $20,500 | $112,400 |
| 2015 | $3,272 | $132,900 | $20,500 | $112,400 |
| 2014 | $3,168 | $132,600 | $20,000 | $112,600 |
Source: Public Records
Map
Nearby Homes
- 220 Virginia Ave
- 342 E Pleasant View Dr
- 303 Virginia Ave
- 119 E Park Ave
- 3314 S Union St
- 3224 SW 2nd St
- 217 E Park Ave
- 206 E Hughes Cir
- 300 Hughes Ave
- 314 E Park Ave
- 309 E Park Ave
- 106 E Creston Ave
- 323 E Broad St
- 3508 Fairlane Dr
- 3503 SW 2nd St
- 612 Creston Ave
- 3303 SE 4th St
- 80 Lacona Ave
- 350 E Creston Ave
- 3308 SW 7th St
- 3106 S Union St
- 3116 South Union St
- 3116 S Union St
- 3102 South Union St
- 3114 South Union St
- 3114 S Union St
- 3028 South Union St
- 3024 S Union St
- 3124 South Union St
- 3024 South Union St
- 3124 S Union St
- 3115 South Union St
- 1 E Pleasant View Dr
- 3115 S Union St
- 3022 South Union St
- 5 E Pleasant View Dr
- 3117 South Union St
- 3117 S Union St
- 3134 South Union St
- 3020 S Union St