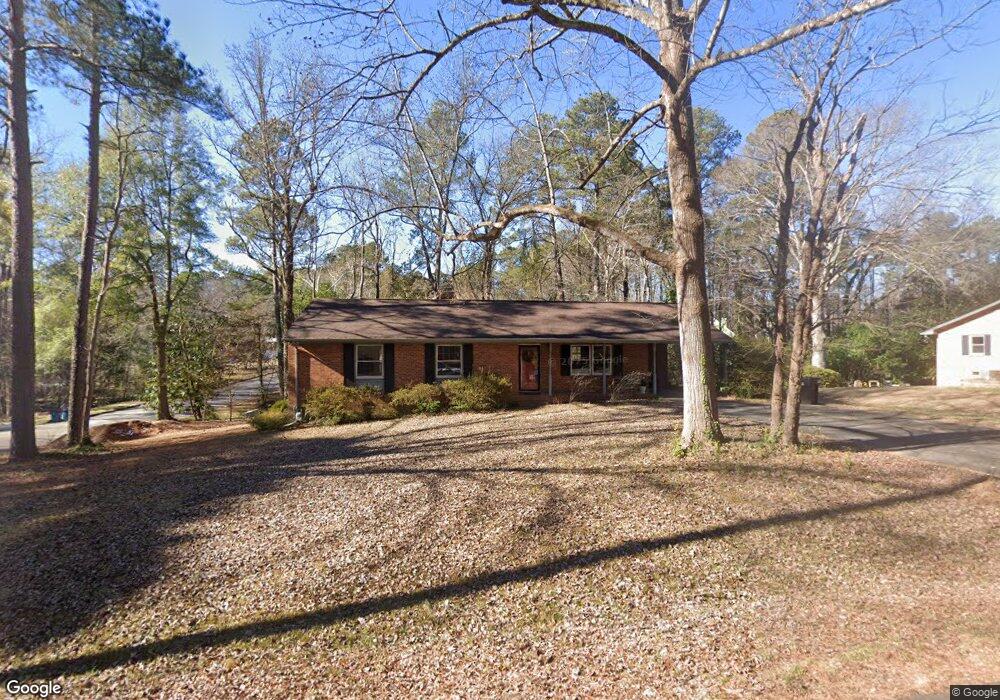
3106 Stanford Dr Durham, NC 27707
South Square NeighborhoodEstimated Value: $436,699 - $503,000
3
Beds
2
Baths
1,515
Sq Ft
$301/Sq Ft
Est. Value
About This Home
This home is located at 3106 Stanford Dr, Durham, NC 27707 and is currently estimated at $456,675, approximately $301 per square foot. 3106 Stanford Dr is a home located in Durham County with nearby schools including Morehead Montessori, Hope Valley Elementary, and Sherwood Githens Middle.
Ownership History
Date
Name
Owned For
Owner Type
Purchase Details
Closed on
Jan 20, 2016
Sold by
Craft James H
Bought by
Melragon Meredith A
Current Estimated Value
Home Financials for this Owner
Home Financials are based on the most recent Mortgage that was taken out on this home.
Original Mortgage
$162,000
Outstanding Balance
$129,178
Interest Rate
4.04%
Estimated Equity
$327,497
Purchase Details
Closed on
Feb 1, 2002
Sold by
Craft Elena Stephanie
Bought by
Craft James H and Craft Mary T
Purchase Details
Closed on
Jul 31, 2000
Sold by
James Fodor and James Janine C
Bought by
Craft Elena Stephanie
Home Financials for this Owner
Home Financials are based on the most recent Mortgage that was taken out on this home.
Original Mortgage
$50,000
Interest Rate
8.12%
Purchase Details
Closed on
Jun 25, 1998
Sold by
Johnson Wanda G
Bought by
Fodor James and Fodor Janine C
Home Financials for this Owner
Home Financials are based on the most recent Mortgage that was taken out on this home.
Original Mortgage
$110,000
Interest Rate
7.04%
Create a Home Valuation Report for This Property
The Home Valuation Report is an in-depth analysis detailing your home's value as well as a comparison with similar homes in the area
Home Values in the Area
Average Home Value in this Area
Purchase History
| Date | Buyer | Sale Price | Title Company |
|---|---|---|---|
| Melragon Meredith A | $203,000 | -- | |
| Craft James H | -- | -- | |
| Craft Elena Stephanie | $138,500 | -- | |
| Fodor James | $130,000 | -- |
Source: Public Records
Mortgage History
| Date | Status | Borrower | Loan Amount |
|---|---|---|---|
| Open | Melragon Meredith A | $162,000 | |
| Previous Owner | Craft Elena Stephanie | $50,000 | |
| Previous Owner | Fodor James | $110,000 |
Source: Public Records
Tax History Compared to Growth
Tax History
| Year | Tax Paid | Tax Assessment Tax Assessment Total Assessment is a certain percentage of the fair market value that is determined by local assessors to be the total taxable value of land and additions on the property. | Land | Improvement |
|---|---|---|---|---|
| 2025 | $3,796 | $382,931 | $207,625 | $175,306 |
| 2024 | $3,639 | $260,901 | $86,595 | $174,306 |
| 2023 | $3,418 | $260,901 | $86,595 | $174,306 |
| 2022 | $3,339 | $260,901 | $86,595 | $174,306 |
| 2021 | $3,324 | $260,901 | $86,595 | $174,306 |
| 2020 | $3,245 | $260,901 | $86,595 | $174,306 |
| 2019 | $3,245 | $260,901 | $86,595 | $174,306 |
| 2018 | $2,675 | $197,224 | $52,710 | $144,514 |
| 2017 | $2,656 | $197,224 | $52,710 | $144,514 |
| 2016 | $2,566 | $197,224 | $52,710 | $144,514 |
| 2015 | $2,623 | $189,513 | $43,373 | $146,140 |
| 2014 | $2,623 | $189,513 | $43,373 | $146,140 |
Source: Public Records
Map
Nearby Homes
- 3125 Stanford Dr
- 2620 Princeton Ave
- 3203 Stanford Dr
- 2700 Princeton Ave
- 3301 Lassiter St
- 2929 Chapel Hill Rd
- 2930 Chapel Hill Rd
- 2438 Alpine Rd
- 2909 Chapel Hill Rd
- 2828 Stuart Dr
- 106 Montrose Dr
- 202 Selkirk Place
- 2235 Alpine Rd
- 180 Montrose Dr
- 2221 Alpine Rd
- 1311 Martin Luther King Junior Pkwy
- 10 Hartford Ct
- 313 W Cornwallis Rd
- 3527 Racine St
- 3306 Swansea St
- 3100 Stanford Dr
- 3108 Stanford Dr
- 3112 Stanford Dr
- 3009 Bexley Ave
- 3103 Stanford Dr
- 3114 Stanford Dr
- 2612 Kamis St
- 3101 Stanford Dr
- 2611 Kamis St
- 3113 Stanford Dr
- 3008 Stanford Dr
- 3116 Stanford Dr
- 3011 Bexley Ave
- 3118 Stanford Dr
- 3115 Stanford Dr
- 3109 Ithaca St
- 3104 Oxford Dr
- 3110 Oxford Dr
- 3010 Bexley Ave
- 2906 Bexley Ave