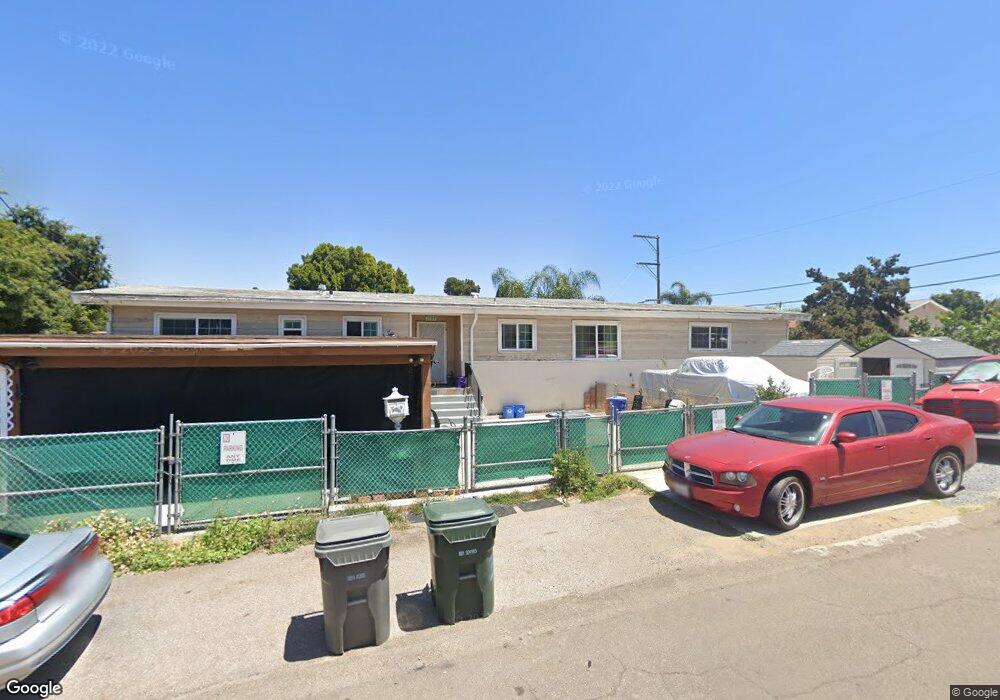
3107 Citrus St Lemon Grove, CA 91945
Estimated Value: $734,000 - $844,612
3
Beds
3
Baths
1,812
Sq Ft
$447/Sq Ft
Est. Value
About This Home
This home is located at 3107 Citrus St, Lemon Grove, CA 91945 and is currently estimated at $809,153, approximately $446 per square foot. 3107 Citrus St is a home located in San Diego County with nearby schools including San Miguel Elementary School, Mount Miguel High School, and Helix High School.
Ownership History
Date
Name
Owned For
Owner Type
Purchase Details
Closed on
May 10, 2004
Sold by
Garcia Marcos A and Garcia Maria H
Bought by
Garcia Marcos A and Garcia Maria H
Current Estimated Value
Purchase Details
Closed on
Jul 23, 1998
Sold by
Va
Bought by
Garcia Marcos A and Garcia Maria H
Home Financials for this Owner
Home Financials are based on the most recent Mortgage that was taken out on this home.
Original Mortgage
$145,320
Outstanding Balance
$29,558
Interest Rate
6.93%
Mortgage Type
Seller Take Back
Estimated Equity
$779,595
Purchase Details
Closed on
Oct 31, 1996
Sold by
Magnolia Federal Bank For Svgs
Bought by
Va
Purchase Details
Closed on
Oct 29, 1996
Sold by
Klein Craig A
Bought by
Magnolia Federal Bank For Svgs
Purchase Details
Closed on
Feb 21, 1985
Create a Home Valuation Report for This Property
The Home Valuation Report is an in-depth analysis detailing your home's value as well as a comparison with similar homes in the area
Home Values in the Area
Average Home Value in this Area
Purchase History
| Date | Buyer | Sale Price | Title Company |
|---|---|---|---|
| Garcia Marcos A | -- | Ticor Title | |
| Garcia Marcos A | $148,000 | -- | |
| Va | -- | Chicago Title Co | |
| Magnolia Federal Bank For Svgs | $140,041 | Chicago Title Co | |
| -- | $113,700 | -- |
Source: Public Records
Mortgage History
| Date | Status | Borrower | Loan Amount |
|---|---|---|---|
| Open | Garcia Marcos A | $145,320 |
Source: Public Records
Tax History Compared to Growth
Tax History
| Year | Tax Paid | Tax Assessment Tax Assessment Total Assessment is a certain percentage of the fair market value that is determined by local assessors to be the total taxable value of land and additions on the property. | Land | Improvement |
|---|---|---|---|---|
| 2025 | $5,530 | $411,004 | $174,349 | $236,655 |
| 2024 | $5,530 | $402,946 | $170,931 | $232,015 |
| 2023 | $5,392 | $395,046 | $167,580 | $227,466 |
| 2022 | $5,364 | $387,301 | $164,295 | $223,006 |
| 2021 | $5,293 | $379,708 | $161,074 | $218,634 |
| 2020 | $5,233 | $375,816 | $159,423 | $216,393 |
| 2019 | $5,140 | $368,448 | $156,298 | $212,150 |
| 2018 | $5,026 | $361,225 | $153,234 | $207,991 |
| 2017 | $4,952 | $354,143 | $150,230 | $203,913 |
| 2016 | $4,779 | $347,200 | $147,285 | $199,915 |
| 2015 | $4,751 | $341,986 | $145,073 | $196,913 |
| 2014 | $4,566 | $335,288 | $142,232 | $193,056 |
Source: Public Records
Map
Nearby Homes
- 3173 Vista Ave
- 3144 Vista Ave
- 3246 Citrus St
- 3255 Massachusetts Ave Unit 57
- 7442 Daytona St
- 3150-52 New Jersey Ave
- 2985 New Jersey Ave
- 2673 Massachusetts Ave
- 2745 Mercury Dr
- 2542 Glebe Rd
- 2618 Sheri Ln
- 2780 Buena Vista Ave
- 2760 Buena Vista Ave
- 8122 8124 Lincoln St
- 2841 2843 Crane
- 1913 1919 Ensenada St
- 7001 Lemonwood Ln
- 3015 Olive St
- 2363 Mcknight Dr
- 7505-7 Mount Vernon St
- 7318 Central Ave
- 3127 Citrus St
- 7298 Central Ave
- 3141 Citrus St
- 7315 Central Ave
- 7340 Central Ave
- 7284 Central Ave Unit 86
- 3144 Citrus St
- 7333 Barkeath Dr Unit 35
- 7345 Central Ave Unit 47
- 7280 Central Ave Unit 82
- 7303 Central Ave Unit D
- 7303 Central Ave Unit C
- 3150 Citrus St
- 7358 Central Ave
- 7279 Central Ave Unit 81
- 3161 Citrus St
- 7305 Central Ave Unit 9
- 7353 Central Ave
- 7287 Central Ave