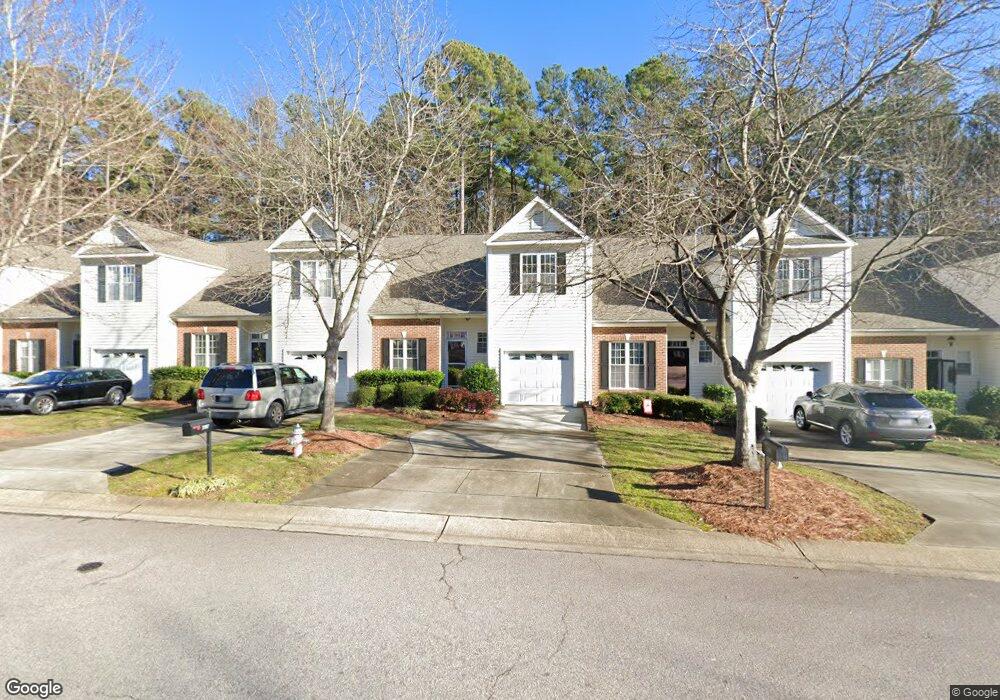
3107 Coxindale Dr Raleigh, NC 27615
Durant NeighborhoodEstimated Value: $375,752 - $409,000
3
Beds
3
Baths
1,905
Sq Ft
$208/Sq Ft
Est. Value
About This Home
This home is located at 3107 Coxindale Dr, Raleigh, NC 27615 and is currently estimated at $396,938, approximately $208 per square foot. 3107 Coxindale Dr is a home located in Wake County with nearby schools including Durant Road Elementary, Durant Road Middle, and Millbrook High School.
Ownership History
Date
Name
Owned For
Owner Type
Purchase Details
Closed on
Mar 2, 2021
Sold by
Herring John W and Herring John
Bought by
Herring John W
Current Estimated Value
Home Financials for this Owner
Home Financials are based on the most recent Mortgage that was taken out on this home.
Original Mortgage
$219,000
Outstanding Balance
$196,318
Interest Rate
2.7%
Mortgage Type
New Conventional
Estimated Equity
$200,620
Purchase Details
Closed on
Jun 23, 2016
Sold by
Mccarty Alan S and Uldrick Jann Paul
Bought by
Herring John
Home Financials for this Owner
Home Financials are based on the most recent Mortgage that was taken out on this home.
Original Mortgage
$233,689
Interest Rate
3.64%
Mortgage Type
FHA
Purchase Details
Closed on
Sep 30, 2014
Sold by
Mccarty Alan S
Bought by
Mccarty Alan S and Uldrick Jann Paul
Purchase Details
Closed on
Dec 14, 2000
Sold by
H J Morris Construction Inc
Bought by
Mccarty Alan S
Home Financials for this Owner
Home Financials are based on the most recent Mortgage that was taken out on this home.
Original Mortgage
$127,750
Interest Rate
7.81%
Create a Home Valuation Report for This Property
The Home Valuation Report is an in-depth analysis detailing your home's value as well as a comparison with similar homes in the area
Home Values in the Area
Average Home Value in this Area
Purchase History
| Date | Buyer | Sale Price | Title Company |
|---|---|---|---|
| Herring John W | -- | None Available | |
| Herring John | $238,000 | None Available | |
| Mccarty Alan S | -- | None Available | |
| Mccarty Alan S | $160,000 | -- |
Source: Public Records
Mortgage History
| Date | Status | Borrower | Loan Amount |
|---|---|---|---|
| Open | Herring John W | $219,000 | |
| Closed | Herring John | $233,689 | |
| Previous Owner | Mccarty Alan S | $127,750 |
Source: Public Records
Tax History Compared to Growth
Tax History
| Year | Tax Paid | Tax Assessment Tax Assessment Total Assessment is a certain percentage of the fair market value that is determined by local assessors to be the total taxable value of land and additions on the property. | Land | Improvement |
|---|---|---|---|---|
| 2025 | $3,313 | $377,599 | $85,000 | $292,599 |
| 2024 | $3,299 | $377,599 | $85,000 | $292,599 |
| 2023 | $2,788 | $253,954 | $46,000 | $207,954 |
| 2022 | $2,591 | $253,954 | $46,000 | $207,954 |
| 2021 | $2,491 | $253,954 | $46,000 | $207,954 |
| 2020 | $2,446 | $253,954 | $46,000 | $207,954 |
| 2019 | $2,213 | $189,219 | $38,000 | $151,219 |
| 2018 | $2,087 | $189,219 | $38,000 | $151,219 |
| 2017 | $1,988 | $189,219 | $38,000 | $151,219 |
| 2016 | $1,948 | $189,219 | $38,000 | $151,219 |
| 2015 | $1,994 | $190,623 | $38,000 | $152,623 |
| 2014 | $1,892 | $190,623 | $38,000 | $152,623 |
Source: Public Records
Map
Nearby Homes
- 2509 Goudy Dr
- 8800 Harps Mill Rd
- 8516 Wheeling Dr
- 2709 Iman Dr
- 8621 Swarthmore Dr
- 2516 Constitution Dr
- 2353 Florida Ct
- 2505 Coxindale Dr
- 2328 Florida Ct
- 8600 Clivedon Dr
- 8730 Courage Ct
- 2301 Declaration Dr
- 2216 Gresham Lake Rd
- 2317 Declaration Dr
- 8700 Den Ct
- 7316 Massachusetts Ct
- 8324 Bellingham Cir
- 2901 Hiking Trail
- 2105 Prescott Place
- 3212 Loyal Ln
- 3105 Coxindale Dr
- 3103 Coxindale Dr
- 3101 Coxindale Dr
- 3111 Coxindale Dr
- 3113 Coxindale Dr
- 2600 Gainswood Ct
- 2602 Gainswood Ct
- 2604 Gainswood Ct
- 3100 Coxindale Dr
- 3121 Coxindale Dr
- 3104 Coxindale Dr
- 3106 Coxindale Dr
- 3123 Coxindale Dr
- 2514 Fort Hill Ct
- 2512 Fort Hill Ct
- 3125 Coxindale Dr
- 2610 Gainswood Ct
- 2510 Fort Hill Ct
- 3120 Coxindale Dr
- 3127 Coxindale Dr