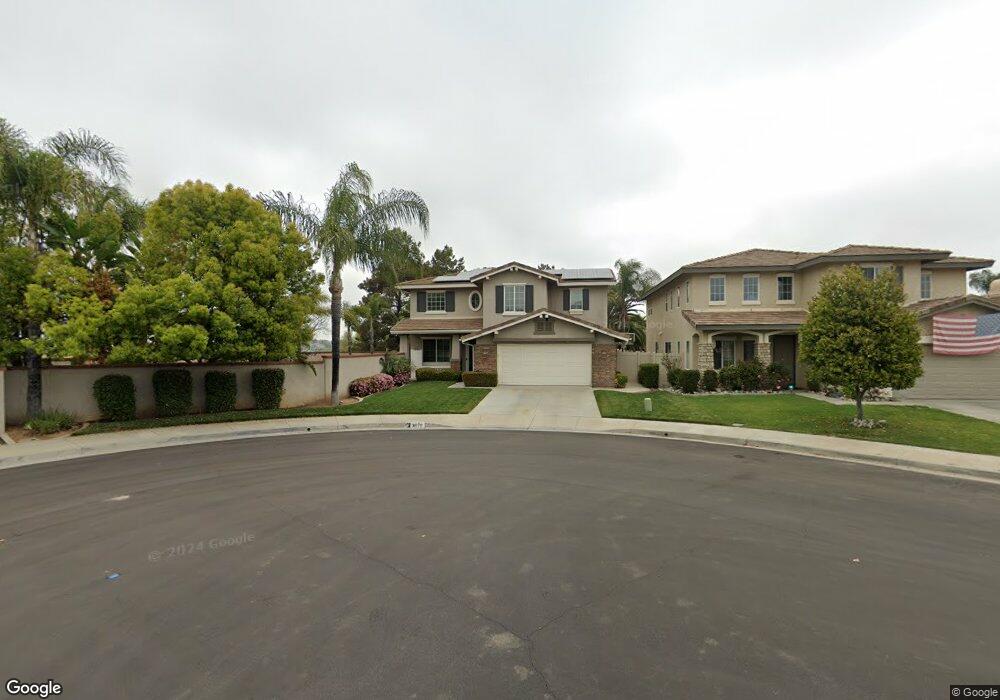
31070 Florence Ct Winchester, CA 92596
Estimated Value: $656,000 - $713,346
4
Beds
3
Baths
2,644
Sq Ft
$260/Sq Ft
Est. Value
About This Home
This home is located at 31070 Florence Ct, Winchester, CA 92596 and is currently estimated at $688,337, approximately $260 per square foot. 31070 Florence Ct is a home located in Riverside County with nearby schools including French Valley Elementary School, Bella Vista Middle School, and Chaparral High School.
Ownership History
Date
Name
Owned For
Owner Type
Purchase Details
Closed on
Feb 8, 2011
Sold by
Hughes Matthew E and Hughes Kristin K
Bought by
Abbe Marcus Rost and Abbe Michelle Virginia
Current Estimated Value
Home Financials for this Owner
Home Financials are based on the most recent Mortgage that was taken out on this home.
Original Mortgage
$249,500
Interest Rate
4.83%
Mortgage Type
VA
Purchase Details
Closed on
Jul 11, 2003
Sold by
Hughes Matthew Edward and Hughes Kristin Kay
Bought by
Hughes Matthew E and Hughes Kristin K
Purchase Details
Closed on
Jun 6, 2002
Sold by
Barratt American Inc
Bought by
Hughes Matthew Edward and Hughes Kristin Kay
Home Financials for this Owner
Home Financials are based on the most recent Mortgage that was taken out on this home.
Original Mortgage
$260,059
Interest Rate
7.25%
Create a Home Valuation Report for This Property
The Home Valuation Report is an in-depth analysis detailing your home's value as well as a comparison with similar homes in the area
Home Values in the Area
Average Home Value in this Area
Purchase History
| Date | Buyer | Sale Price | Title Company |
|---|---|---|---|
| Abbe Marcus Rost | $249,500 | North American Title Company | |
| Hughes Matthew E | -- | New Century | |
| Hughes Matthew Edward | $290,000 | First American Title Co |
Source: Public Records
Mortgage History
| Date | Status | Borrower | Loan Amount |
|---|---|---|---|
| Previous Owner | Abbe Marcus Rost | $249,500 | |
| Previous Owner | Hughes Matthew Edward | $260,059 |
Source: Public Records
Tax History Compared to Growth
Tax History
| Year | Tax Paid | Tax Assessment Tax Assessment Total Assessment is a certain percentage of the fair market value that is determined by local assessors to be the total taxable value of land and additions on the property. | Land | Improvement |
|---|---|---|---|---|
| 2025 | $3,899 | $319,639 | $89,674 | $229,965 |
| 2023 | $3,899 | $307,229 | $86,193 | $221,036 |
| 2022 | $3,728 | $301,205 | $84,503 | $216,702 |
| 2021 | $3,627 | $295,300 | $82,847 | $212,453 |
| 2020 | $3,558 | $292,273 | $81,998 | $210,275 |
| 2019 | $3,498 | $286,543 | $80,391 | $206,152 |
| 2018 | $3,441 | $280,925 | $78,816 | $202,109 |
| 2017 | $3,388 | $275,418 | $77,271 | $198,147 |
| 2016 | $3,327 | $270,018 | $75,756 | $194,262 |
| 2015 | $3,275 | $265,964 | $74,619 | $191,345 |
| 2014 | $3,191 | $260,756 | $73,158 | $187,598 |
Source: Public Records
Map
Nearby Homes
- 36045 Glasgow St
- 31431 Bradford St
- 31369 Frans Hals Dr
- 36143 Tahoe St
- 31309 Van Ruysdael Ln
- 30873 Bald Eagle St
- 31556 Umbria Ln
- 30951 Benton Rd
- 31343 Tulette Ln
- 31572 Adour Way
- 36123 Joltaire Way
- 36039 Joltaire Way
- 31619 Umbria Ln
- 35718 Elk Ln
- 35781 Bobcat Way
- 31460 Tulette Ln
- 31771 Biagio Way
- 30570 Fox Sedge Way
- 36315 Antoinette Ln
- 35908 Curie Ct
- 31080 Florence Ct
- 0 Leon Rd Unit T08017694
- 0 Leon Rd Unit CC260434
- 0 Leon Rd Unit T08061615
- 0 Leon Rd Unit S538763
- 0 Leon Rd Unit OC14253116
- 0 Leon Unit SW15095372
- 0 Leon Rd Unit CRIV22128490
- 0 Leon Rd Unit IV22128490
- 0 Leon Rd Unit SW19005710
- 31090 Florence Ct
- 31073 Manford Dr
- 31083 Manford Dr
- 31093 Manford Dr
- 31065 Florence Ct
- 31100 Florence Ct
- 31103 Manford Dr
- 31085 Florence Ct
- 31110 Florence Ct
- 31113 Manford Dr