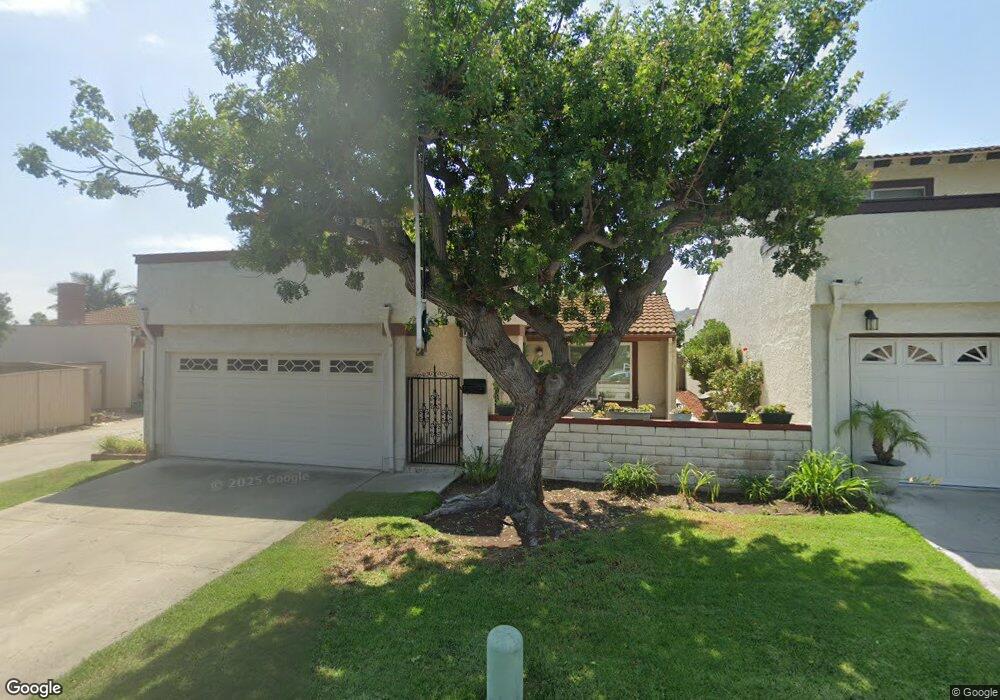
31077 Via San Vicente San Juan Capistrano, CA 92675
Estimated Value: $806,884 - $1,065,000
2
Beds
2
Baths
1,451
Sq Ft
$640/Sq Ft
Est. Value
About This Home
This home is located at 31077 Via San Vicente, San Juan Capistrano, CA 92675 and is currently estimated at $929,221, approximately $640 per square foot. 31077 Via San Vicente is a home located in Orange County with nearby schools including San Juan Elementary School, Marco Forster Middle School, and San Juan Hills High School.
Ownership History
Date
Name
Owned For
Owner Type
Purchase Details
Closed on
Dec 13, 2022
Sold by
Robe Robe Family Trust and Robe Thomas Henry
Bought by
Thomas Henry Robe And Laurie Lynn Robe Trust and Robe
Current Estimated Value
Purchase Details
Closed on
Dec 20, 2007
Sold by
Robe Thomas Henry and Robe Laurie Lynn
Bought by
Robe Thomas Henry and Robe Laurie Lynn
Purchase Details
Closed on
Oct 8, 2004
Sold by
Fowler Laurei L
Bought by
Fowler Laurie L and Robe Thomas H
Purchase Details
Closed on
Feb 25, 1997
Sold by
Fowler Laurie L
Bought by
Fowler Laurie L
Home Financials for this Owner
Home Financials are based on the most recent Mortgage that was taken out on this home.
Original Mortgage
$15,500
Interest Rate
7.56%
Purchase Details
Closed on
Aug 6, 1996
Sold by
Fowler Michael G and Fowler Laurie L
Bought by
Fowler Laurie L
Create a Home Valuation Report for This Property
The Home Valuation Report is an in-depth analysis detailing your home's value as well as a comparison with similar homes in the area
Home Values in the Area
Average Home Value in this Area
Purchase History
| Date | Buyer | Sale Price | Title Company |
|---|---|---|---|
| Thomas Henry Robe And Laurie Lynn Robe Trust | -- | None Listed On Document | |
| Robe Thomas Henry | -- | None Available | |
| Fowler Laurie L | -- | -- | |
| Fowler Laurie L | -- | American Title Co | |
| Fowler Laurie L | -- | Chicago Title Co |
Source: Public Records
Mortgage History
| Date | Status | Borrower | Loan Amount |
|---|---|---|---|
| Previous Owner | Fowler Laurie L | $15,500 |
Source: Public Records
Tax History Compared to Growth
Tax History
| Year | Tax Paid | Tax Assessment Tax Assessment Total Assessment is a certain percentage of the fair market value that is determined by local assessors to be the total taxable value of land and additions on the property. | Land | Improvement |
|---|---|---|---|---|
| 2025 | $3,700 | $330,678 | $197,086 | $133,592 |
| 2024 | $3,700 | $324,195 | $193,222 | $130,973 |
| 2023 | $3,564 | $317,839 | $189,434 | $128,405 |
| 2022 | $3,229 | $311,607 | $185,719 | $125,888 |
| 2021 | $3,169 | $305,498 | $182,078 | $123,420 |
| 2020 | $3,141 | $302,366 | $180,211 | $122,155 |
| 2019 | $3,083 | $296,438 | $176,678 | $119,760 |
| 2018 | $3,028 | $290,626 | $173,214 | $117,412 |
| 2017 | $3,000 | $284,928 | $169,818 | $115,110 |
| 2016 | $2,945 | $279,342 | $166,489 | $112,853 |
| 2015 | $2,900 | $275,147 | $163,989 | $111,158 |
| 2014 | $2,849 | $269,758 | $160,777 | $108,981 |
Source: Public Records
Map
Nearby Homes
- 31261 Paseo Olivos
- 30981 Via Mirador
- 31278 Calle San Juan Unit 12
- 31284 Calle San Juan Unit 14
- 31024 Calle San Diego Unit 94b
- 26468 Calle San Antonio
- 26447 Paseo Carmel Unit 11D
- 30828 Calle Chueca
- 27381 Via Priorato
- 31377 Los Rios St Unit 64
- 90 Plaza de Las Flores
- 31608 Los Rios St Unit 147
- 0 Aguacate Rd Unit 25558127
- 30532 Marbella Vista
- 31527 Aguacate Rd
- 27591 Rolling Wood Ln
- 27703 Ortega Hwy Unit 13
- 27703 Ortega Hwy Unit 127
- 30372 Marbella Vista
- 27681 Paseo Esteban
- 31075 Via San Vicente
- 31081 Via San Vicente
- 31086 Calle Santa Rosalia
- 31082 Calle Santa Rosalia
- 31092 Calle Santa Rosalia
- 31071 Via San Vicente
- 31091 Via San Vicente
- 31076 Calle Santa Rosalia
- 31067 Via San Vicente
- 31065 Via San Vicente
- 31072 Calle Santa Rosalia
- 31096 Calle Santa Rosalia
- 31061 Via San Vicente
- 26761 Via el Socorro
- 26771 Via el Socorro
- 26751 Via el Socorro
- 31062 Via San Vicente
- 26781 Via el Socorro
- 31102 Calle Santa Rosalia
- 26745 Via el Socorro