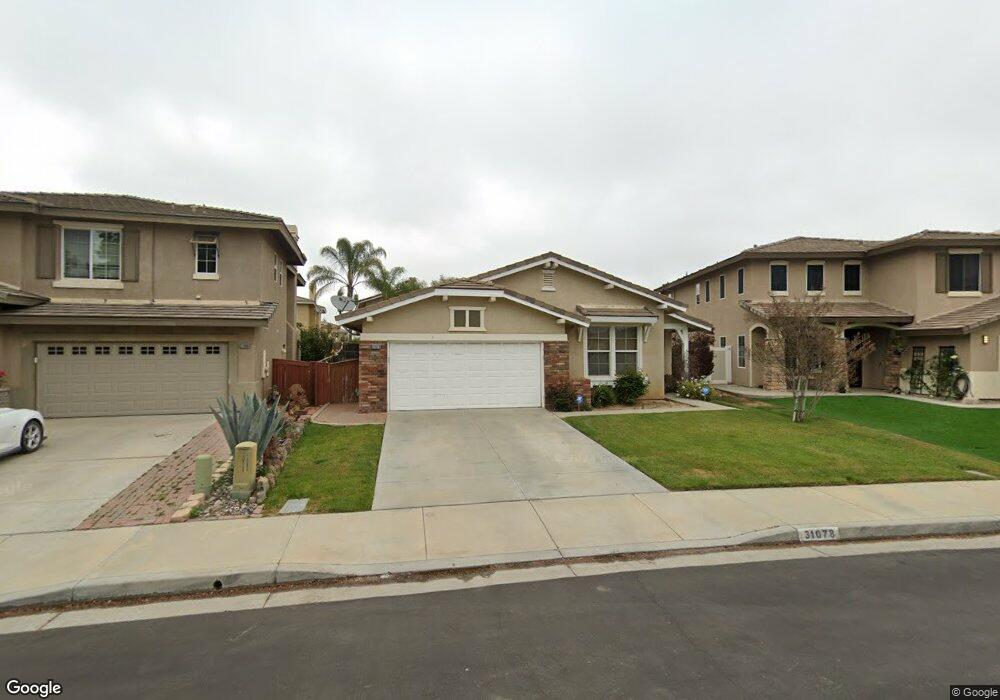
31078 Manford Dr Winchester, CA 92596
Estimated Value: $599,530 - $657,000
3
Beds
2
Baths
2,064
Sq Ft
$304/Sq Ft
Est. Value
About This Home
This home is located at 31078 Manford Dr, Winchester, CA 92596 and is currently estimated at $627,883, approximately $304 per square foot. 31078 Manford Dr is a home with nearby schools including French Valley Elementary School, Bella Vista Middle School, and Chaparral High School.
Ownership History
Date
Name
Owned For
Owner Type
Purchase Details
Closed on
Sep 14, 2021
Sold by
Washburn Brenda A
Bought by
Washburn Brenda A and Ruvo Michael A
Current Estimated Value
Home Financials for this Owner
Home Financials are based on the most recent Mortgage that was taken out on this home.
Original Mortgage
$324,000
Outstanding Balance
$294,816
Interest Rate
2.8%
Mortgage Type
New Conventional
Estimated Equity
$333,067
Purchase Details
Closed on
May 28, 2021
Sold by
Washburn Johnny
Bought by
Washburn Brenda A
Purchase Details
Closed on
Jun 6, 2002
Sold by
Barratt American Inc
Bought by
Washburn Johnny and Washburn Brenda A
Home Financials for this Owner
Home Financials are based on the most recent Mortgage that was taken out on this home.
Original Mortgage
$205,950
Interest Rate
6.71%
Mortgage Type
Purchase Money Mortgage
Create a Home Valuation Report for This Property
The Home Valuation Report is an in-depth analysis detailing your home's value as well as a comparison with similar homes in the area
Home Values in the Area
Average Home Value in this Area
Purchase History
| Date | Buyer | Sale Price | Title Company |
|---|---|---|---|
| Washburn Brenda A | -- | Ticor Title | |
| Washburn Brenda A | -- | Accommodation | |
| Washburn Johnny | $257,500 | Fidelity National Title Co |
Source: Public Records
Mortgage History
| Date | Status | Borrower | Loan Amount |
|---|---|---|---|
| Open | Washburn Brenda A | $324,000 | |
| Closed | Washburn Johnny | $205,950 | |
| Closed | Washburn Johnny | $38,600 |
Source: Public Records
Tax History Compared to Growth
Tax History
| Year | Tax Paid | Tax Assessment Tax Assessment Total Assessment is a certain percentage of the fair market value that is determined by local assessors to be the total taxable value of land and additions on the property. | Land | Improvement |
|---|---|---|---|---|
| 2025 | $4,509 | $372,913 | $81,086 | $291,827 |
| 2023 | $4,509 | $358,435 | $77,939 | $280,496 |
| 2022 | $4,323 | $351,408 | $76,411 | $274,997 |
| 2021 | $4,212 | $344,518 | $74,913 | $269,605 |
| 2020 | $4,137 | $340,986 | $74,145 | $266,841 |
| 2019 | $4,071 | $334,301 | $72,692 | $261,609 |
| 2018 | $4,005 | $327,747 | $71,268 | $256,479 |
| 2017 | $3,944 | $321,321 | $69,871 | $251,450 |
| 2016 | $3,872 | $315,021 | $68,501 | $246,520 |
| 2015 | $3,811 | $310,291 | $67,473 | $242,818 |
| 2014 | $3,679 | $301,000 | $65,000 | $236,000 |
Source: Public Records
Map
Nearby Homes
- 36045 Glasgow St
- 31369 Frans Hals Dr
- 31431 Bradford St
- 31309 Van Ruysdael Ln
- 36143 Tahoe St
- 31343 Tulette Ln
- 30873 Bald Eagle St
- 36039 Joltaire Way
- 36123 Joltaire Way
- 31556 Umbria Ln
- 31460 Tulette Ln
- 31619 Umbria Ln
- 35718 Elk Ln
- 31572 Adour Way
- 35648 Loggins Ct
- 31579 Mccartney Dr
- 35908 Curie Ct
- 35781 Bobcat Way
- 31771 Biagio Way
- 30951 Benton Rd
- 31068 Manford Dr
- 31088 Manford Dr
- 31098 Manford Dr
- 31061 Stirling Ct
- 31051 Stirling Ct
- 31071 Stirling Ct
- 31081 Stirling Ct
- 31108 Manford Dr
- 31091 Stirling Ct
- 31073 Manford Dr
- 31083 Manford Dr
- 31101 Stirling Ct
- 31118 Manford Dr
- 31093 Manford Dr
- 31111 Stirling Ct
- 0 Leon Rd Unit T08017694
- 0 Leon Rd Unit CC260434
- 0 Leon Rd Unit T08061615
- 0 Leon Rd Unit S538763
- 0 Leon Rd Unit OC14253116