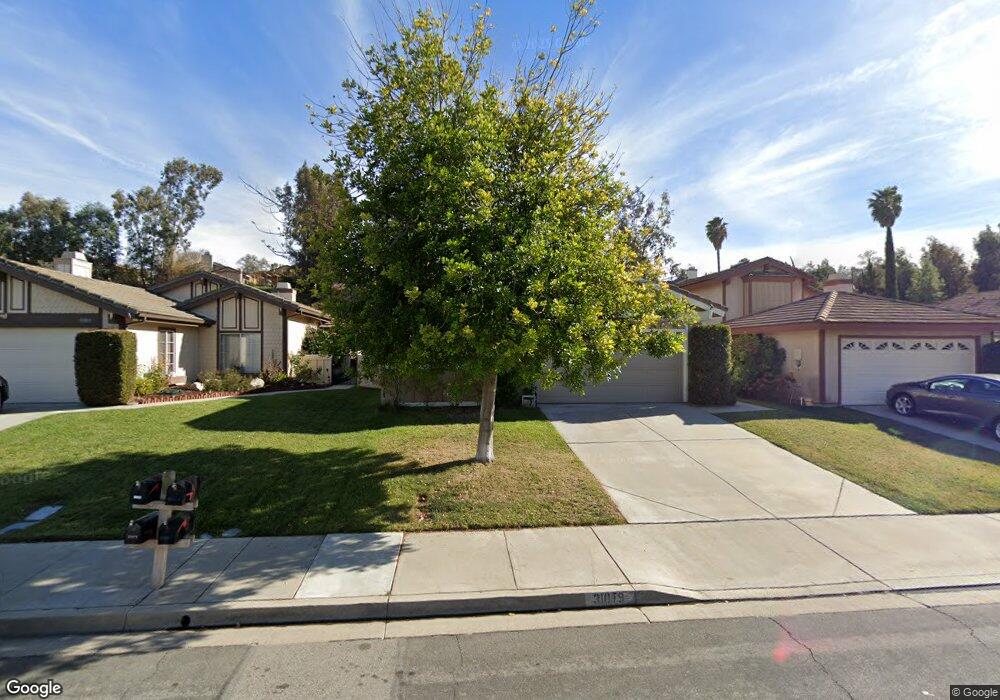
31079 Corte Anza Temecula, CA 92592
Margarita Village-Temeku Hills NeighborhoodEstimated Value: $554,000 - $609,000
2
Beds
2
Baths
1,197
Sq Ft
$485/Sq Ft
Est. Value
About This Home
This home is located at 31079 Corte Anza, Temecula, CA 92592 and is currently estimated at $580,161, approximately $484 per square foot. 31079 Corte Anza is a home located in Riverside County with nearby schools including Vintage Hills Elementary School, Margarita Middle School, and Temecula Valley High School.
Ownership History
Date
Name
Owned For
Owner Type
Purchase Details
Closed on
Jul 6, 2013
Sold by
Cutler David B and Cutler Janine B
Bought by
Cutler David and Cutler Janine
Current Estimated Value
Purchase Details
Closed on
Apr 15, 2010
Sold by
Fitzgerald Karin and Fitzgerald Michael
Bought by
Cutler David B and Cutler Janine B
Home Financials for this Owner
Home Financials are based on the most recent Mortgage that was taken out on this home.
Original Mortgage
$175,634
Interest Rate
5.03%
Mortgage Type
FHA
Purchase Details
Closed on
Mar 31, 2005
Sold by
Archer Kenneth J
Bought by
Fitzgerald Michael and Rieckhoff Karin
Home Financials for this Owner
Home Financials are based on the most recent Mortgage that was taken out on this home.
Original Mortgage
$345,657
Interest Rate
6.02%
Mortgage Type
Fannie Mae Freddie Mac
Create a Home Valuation Report for This Property
The Home Valuation Report is an in-depth analysis detailing your home's value as well as a comparison with similar homes in the area
Home Values in the Area
Average Home Value in this Area
Purchase History
| Date | Buyer | Sale Price | Title Company |
|---|---|---|---|
| Cutler David | -- | None Available | |
| Cutler David B | $178,000 | Chicago Title Inland Empire | |
| Fitzgerald Michael | $364,000 | Itc Sb |
Source: Public Records
Mortgage History
| Date | Status | Borrower | Loan Amount |
|---|---|---|---|
| Previous Owner | Cutler David B | $175,634 | |
| Previous Owner | Fitzgerald Michael | $345,657 |
Source: Public Records
Tax History
| Year | Tax Paid | Tax Assessment Tax Assessment Total Assessment is a certain percentage of the fair market value that is determined by local assessors to be the total taxable value of land and additions on the property. | Land | Improvement |
|---|---|---|---|---|
| 2025 | $3,094 | $229,748 | $64,531 | $165,217 |
| 2023 | $3,094 | $220,828 | $62,026 | $158,802 |
| 2022 | $2,994 | $216,499 | $60,810 | $155,689 |
| 2021 | $2,928 | $212,255 | $59,618 | $152,637 |
| 2020 | $2,895 | $210,079 | $59,007 | $151,072 |
| 2019 | $2,852 | $205,960 | $57,850 | $148,110 |
| 2018 | $2,795 | $201,922 | $56,716 | $145,206 |
| 2017 | $2,744 | $197,963 | $55,604 | $142,359 |
| 2016 | $2,696 | $194,082 | $54,514 | $139,568 |
| 2015 | $2,648 | $191,169 | $53,697 | $137,472 |
| 2014 | $2,570 | $187,427 | $52,647 | $134,780 |
Source: Public Records
Map
Nearby Homes
- 31060 Corte Anza
- 31049 Corte Arroyo Vista
- 31077 Bunker Dr
- 41454 Avenida de la Reina
- 31386 Corte San Leandro
- 41911 Driver Ln
- 41943 Niblick Rd
- 31384 Corte Tunas
- 31475 Corte Mallorca
- 31376 Corte Montiel
- 42040 Teatree Ct
- 42919 Corte Abanilla
- 31130 S General Kearny Rd Unit 89
- 31130 S General Kearny Rd Unit 145
- 31130 S General Kearny Rd Unit 147
- 31130 S General Kearny Rd Unit 153
- 31130 S General Kearny Rd Unit 134
- 42230 Cosmic Dr
- 31335 Cala Carrasco
- 41552 Willow Run Rd
- 31073 Corte Anza
- 31085 Corte Anza
- 31067 Corte Anza
- 31091 Corte Anza
- 31061 Corte Anza
- 31097 Corte Anza
- 31106 Calle Aragon
- 31100 Calle Aragon
- 31112 Calle Aragon
- 31094 Calle Aragon
- 31118 Calle Aragon
- 31055 Corte Anza
- 31088 Calle Aragon
- 31103 Corte Anza
- 31124 Calle Aragon
- 31082 Calle Aragon
- 31049 Corte Anza
- 31078 Corte Anza
- 31084 Corte Anza
- 31109 Corte Anza
Your Personal Tour Guide
Ask me questions while you tour the home.