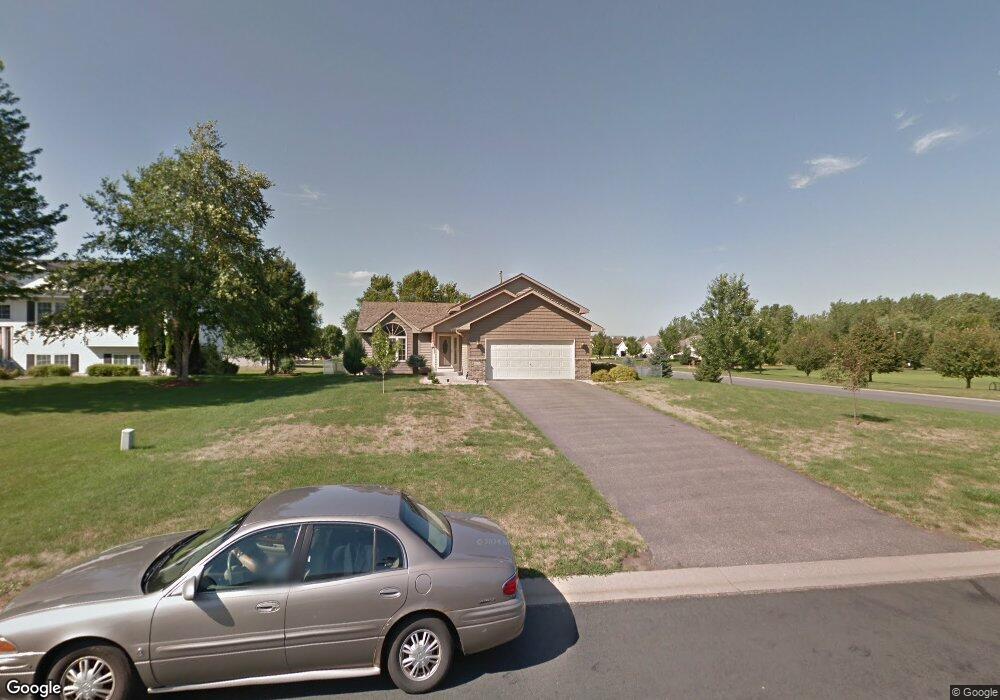
3109 201st St W Farmington, MN 55024
Estimated Value: $383,000 - $432,000
4
Beds
2
Baths
1,759
Sq Ft
$231/Sq Ft
Est. Value
About This Home
This home is located at 3109 201st St W, Farmington, MN 55024 and is currently estimated at $406,275, approximately $230 per square foot. 3109 201st St W is a home located in Dakota County with nearby schools including Riverview Elementary School, Robert Boeckman Middle School, and Farmington High School.
Ownership History
Date
Name
Owned For
Owner Type
Purchase Details
Closed on
Jun 27, 2013
Sold by
Wells Fargo Bank Na
Bought by
Bixby Timothy A and Nelson Kellie K
Current Estimated Value
Purchase Details
Closed on
Dec 31, 2012
Sold by
Bixby Kellie K and Nelson Kellie K
Bought by
Knudsen Ross J and Knudsen Julie A
Home Financials for this Owner
Home Financials are based on the most recent Mortgage that was taken out on this home.
Original Mortgage
$171,830
Interest Rate
3.25%
Mortgage Type
FHA
Purchase Details
Closed on
Oct 24, 2012
Sold by
Bixby Timothya and Nelson Kellie K
Bought by
Wells Fargo Bank Na
Purchase Details
Closed on
May 8, 2003
Sold by
Stephens Todd M and Stephens Michelle L
Bought by
Bixby Timothy A and Nelson Kellie K
Purchase Details
Closed on
Sep 2, 1998
Sold by
Hansen Construction Company
Bought by
Stephens Todd M
Purchase Details
Closed on
Apr 25, 1998
Sold by
Sovereign Investments Inc
Bought by
Stephens Todd M and Stephens Michelle L
Create a Home Valuation Report for This Property
The Home Valuation Report is an in-depth analysis detailing your home's value as well as a comparison with similar homes in the area
Home Values in the Area
Average Home Value in this Area
Purchase History
| Date | Buyer | Sale Price | Title Company |
|---|---|---|---|
| Bixby Timothy A | -- | Title Recording Services Inc | |
| Knudsen Ross J | $175,000 | Title Recording Services Inc | |
| Wells Fargo Bank Na | $597,539 | None Available | |
| Bixby Timothy A | $207,000 | -- | |
| Stephens Todd M | $143,600 | -- | |
| Stephens Todd M | $34,900 | -- |
Source: Public Records
Mortgage History
| Date | Status | Borrower | Loan Amount |
|---|---|---|---|
| Previous Owner | Knudsen Ross J | $171,830 |
Source: Public Records
Tax History Compared to Growth
Tax History
| Year | Tax Paid | Tax Assessment Tax Assessment Total Assessment is a certain percentage of the fair market value that is determined by local assessors to be the total taxable value of land and additions on the property. | Land | Improvement |
|---|---|---|---|---|
| 2024 | $3,600 | $349,900 | $98,200 | $251,700 |
| 2023 | $3,600 | $327,800 | $93,400 | $234,400 |
| 2022 | $3,854 | $324,100 | $93,500 | $230,600 |
| 2021 | $3,336 | $279,300 | $77,900 | $201,400 |
| 2020 | $3,156 | $261,200 | $75,600 | $185,600 |
| 2019 | $3,648 | $237,400 | $72,000 | $165,400 |
| 2018 | $2,844 | $242,400 | $72,000 | $170,400 |
| 2017 | $2,909 | $217,100 | $68,600 | $148,500 |
| 2016 | $2,866 | $217,200 | $68,600 | $148,600 |
| 2015 | $2,557 | $207,000 | $66,900 | $140,100 |
| 2014 | -- | $199,400 | $61,000 | $138,400 |
| 2013 | -- | $182,500 | $55,800 | $126,700 |
Source: Public Records
Map
Nearby Homes
- 20020 Cabrilla Way
- 19917 Butternut Trail
- 3370 201st St W
- 19722 Cabrilla Way
- 19604 Cambridge Ct
- 19713 Brooklyn Trail
- 19641 Camrose Way
- 19638 Camrose Way
- xxx 200th St W
- 20155 Biscayne Ave W
- 329 Tamarack Trail Unit 203
- 3667 205th St W
- 274 Tamarack Trail Unit 805
- 19361 Clearwater Loop
- 19275 Clearwater Loop
- 19318 Colonial Trail
- 19363 Colonial Trail
- 19335 Colonial Trail
- 3296 191st St W
- 3708 192nd St W
- 3109 3109 201st-Street-w
- 3117 201st St W
- 3098 200th St W
- 3122 200th St W
- 3127 201st St W
- 3112 201st St W
- 3142 200th St W
- 20102 Calgary Trail
- 3126 201st St W
- 3135 201st St W
- 20109 Calgary Trail
- 19961 Calgary Trail
- 3162 200th St W
- 19960 Calgary Trail
- 3134 201st St W
- 3121 200th St W
- 19941 Calgary Trail
- 3179 201st St W
- 3137 200th St W
- 20108 Caldwell Ct