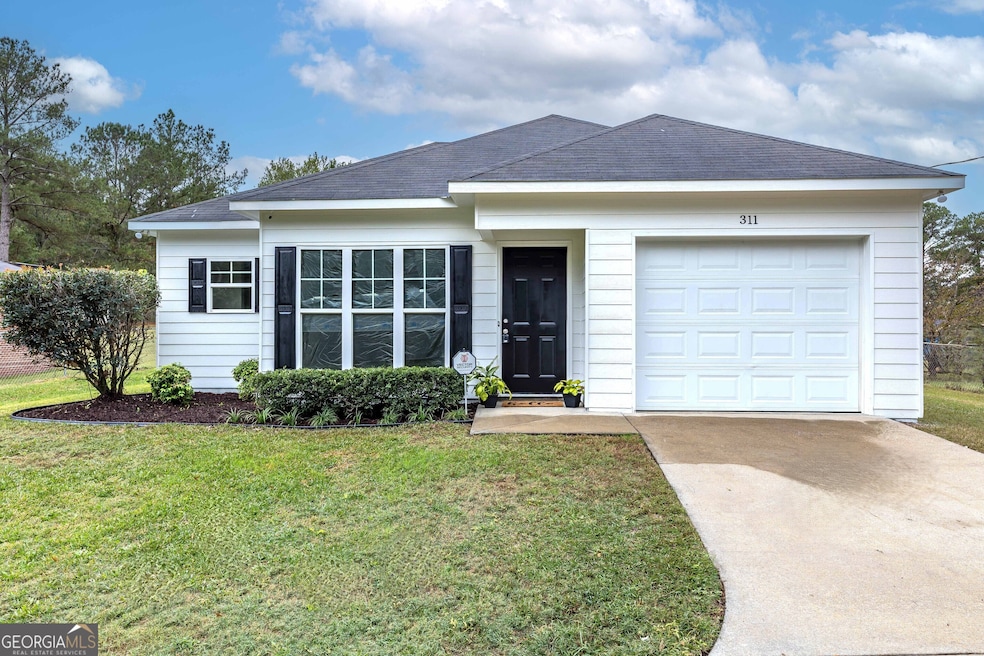
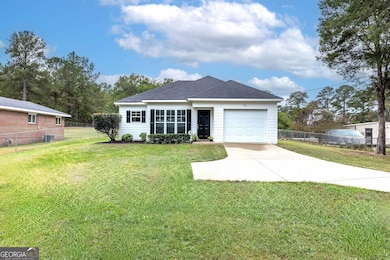


311 23rd Ct Phenix City, AL 36869
Estimated payment $1,100/month
Highlights
- Popular Property
- Ranch Style House
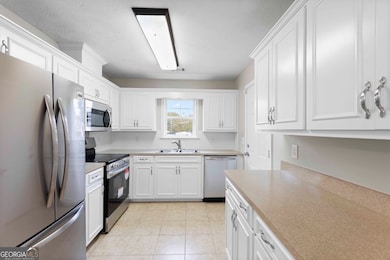
- Stainless Steel Appliances
- Central Freshman Academy Rated 10
- No HOA
- Double Vanity
About This Home
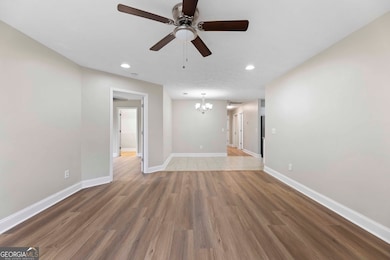
DON'T MISS this ADORABLE one story in Phenix City with 1,163 sq ft on 1/2 acre lot with partially Fenced Backyard + NO CARPET + new LVP flooring + ALL NEW Stainless Steel Appliances + FRESH PAINT inside & out = MOVE-IN READY gem just waiting for you to call it HOME! Gorgeous NEW wood-look LVP flooring throughout ONE LEVEL home's spacious Living Room & 3 Bedrooms, PLUS Dual Sink Vanity & Walk-in Closet in Owner's Suite. Dining area in well-appointed Kitchen boasting NEW Energy-Efficient Appliances + additional Counters/Cabinets for the IDEAL Coffee Bar &/or Food Prep Station with Storage + freshly PAINTED Cabinets! Outdoor fun and entertainment await your MASSIVE, partially Fenced Backyard with Patio, PLUS plenty of room to roam! Manicured, welcoming front entry's drive includes turnaround space from your single GARAGE. This property is a short distance from major highways offering an easy commute to Fort Benning, Columbus, &/or Auburn/Opelika. Close to city conveniences like shopping, dining, sports & recreational activities + schools. Schedule a private tour and submit your offer TODAY!
Home Details
Home Type
- Single Family
Est. Annual Taxes
- $619
Year Built
- Built in 2009
Lot Details
- 0.51 Acre Lot
- Back Yard Fenced
- Level Lot
Parking
- 1 Car Garage
Home Design
- Ranch Style House
- Slab Foundation
- Composition Roof
Interior Spaces
- 1,163 Sq Ft Home
- Ceiling Fan
- Pull Down Stairs to Attic
- Laundry Room
Kitchen
- Oven or Range
- Microwave
- Dishwasher
- Stainless Steel Appliances
Flooring
- Tile
- Vinyl
Bedrooms and Bathrooms
- 3 Main Level Bedrooms
- Walk-In Closet
- 2 Full Bathrooms
- Double Vanity
Schools
- Ridgecrest Elementary School
- South Girard Middle School
Utilities
- Central Heating and Cooling System
- Heat Pump System
- Electric Water Heater
- Cable TV Available
Additional Features
- Patio
- City Lot
Community Details
- No Home Owners Association
Map
Home Values in the Area
Average Home Value in this Area
Tax History
| Year | Tax Paid | Tax Assessment Tax Assessment Total Assessment is a certain percentage of the fair market value that is determined by local assessors to be the total taxable value of land and additions on the property. | Land | Improvement |
|---|---|---|---|---|
| 2024 | $619 | $11,730 | $760 | $10,970 |
| 2023 | $556 | $10,677 | $759 | $9,918 |
| 2022 | $512 | $9,939 | $759 | $9,180 |
| 2021 | $464 | $9,120 | $759 | $8,361 |
| 2020 | $446 | $8,820 | $760 | $8,060 |
| 2019 | $386 | $7,800 | $760 | $7,040 |
| 2018 | $391 | $7,880 | $760 | $7,120 |
| 2017 | $400 | $7,880 | $760 | $7,120 |
| 2016 | $405 | $8,120 | $760 | $7,360 |
| 2015 | $390 | $7,865 | $757 | $7,108 |
| 2014 | $393 | $7,917 | $658 | $7,259 |
Property History
| Date | Event | Price | List to Sale | Price per Sq Ft |
|---|---|---|---|---|
| 11/20/2025 11/20/25 | Price Changed | $199,900 | -4.8% | $172 / Sq Ft |
| 11/12/2025 11/12/25 | Price Changed | $209,900 | -2.4% | $180 / Sq Ft |
| 10/30/2025 10/30/25 | For Sale | $215,000 | -- | $185 / Sq Ft |
Purchase History
| Date | Type | Sale Price | Title Company |
|---|---|---|---|
| Warranty Deed | -- | -- | |
| Warranty Deed | -- | -- |
Mortgage History
| Date | Status | Loan Amount | Loan Type |
|---|---|---|---|
| Open | $101,821 | Purchase Money Mortgage |
Source: Georgia MLS
MLS Number: 10634642
APN: 05-05-21-04-005-005.000
Disclaimer: Certain information contained herein is derived from information provided by parties other than Homes.com. All information provided is deemed reliable, but is not guaranteed to be accurate and should be independently verified.
![]() The data relating to real estate for sale on this web site comes in part from the Broker Reciprocity Program of Georgia MLS. Real estate listings held by brokerage firms other than Redfin are marked with the Broker Reciprocity logo and detailed information about them includes the name of the listing brokers. Information deemed reliable but not guaranteed. Copyright 2025 Georgia MLS. All rights reserved.
The data relating to real estate for sale on this web site comes in part from the Broker Reciprocity Program of Georgia MLS. Real estate listings held by brokerage firms other than Redfin are marked with the Broker Reciprocity logo and detailed information about them includes the name of the listing brokers. Information deemed reliable but not guaranteed. Copyright 2025 Georgia MLS. All rights reserved.
- 2314 Sandfort Rd
- 703 23rd Ave
- 2421 Sandfort Rd
- 2304 Nail Ct
- 0 Highway 431 Unit E99832
- 640 Builder Dr
- 1 Lexington Cir
- 204 17th Ave S
- 701 Pine Hill Ct
- 2201 Windmark Ct
- 48 Brentwood Dr
- 5 Willow Ct
- 231 17th Ave S
- 64 Brentwood Dr
- 8 Forest Ridge Ct
- 5 Willow Branch Dr
- 50 Ryan Loop
- 30 Brentwood Dr
- 310 Wright Rd
- 809 15th Ave
- 1805 Knowles Rd
- 2213 Summerwind Dr
- 700 22nd Ave
- 501 16th Ave N
- 812 Pine Hill Ct
- 12 Harding Dr
- 851 25th Ave
- 928 28th Ave
- 1704 8th Place S
- 1313 18th Ave
- 2319 College Dr
- 2301 16th Place Unit 9
- 428 Broadway
- 510 Broadway
- 2515 College Dr
- 438 1st Ave Unit ID1043434P
- 423 2nd Ave Unit ID1043431P
- 710 1st Ave Unit B
- 709 2nd Ave Unit A
- 707 2nd Ave Unit ID1043450P
