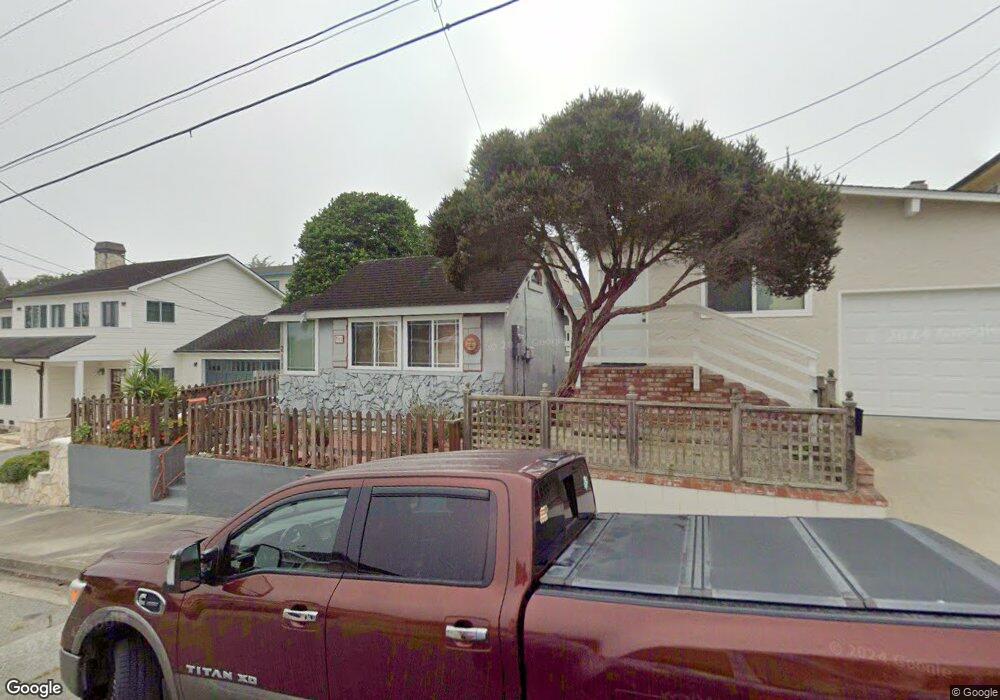
311 7th St Pacific Grove, CA 93950
Estimated Value: $801,986 - $958,000
1
Bed
1
Bath
545
Sq Ft
$1,605/Sq Ft
Est. Value
About This Home
This home is located at 311 7th St, Pacific Grove, CA 93950 and is currently estimated at $874,997, approximately $1,605 per square foot. 311 7th St is a home located in Monterey County with nearby schools including Robert Down Elementary School, Pacific Grove Middle School, and Pacific Grove High School.
Ownership History
Date
Name
Owned For
Owner Type
Purchase Details
Closed on
Jul 11, 2005
Sold by
Gaylor Susan
Bought by
Gaylor Susan and Susan Gaylor Living Trust
Current Estimated Value
Home Financials for this Owner
Home Financials are based on the most recent Mortgage that was taken out on this home.
Original Mortgage
$129,700
Outstanding Balance
$65,318
Interest Rate
5.51%
Mortgage Type
New Conventional
Estimated Equity
$809,679
Purchase Details
Closed on
Jan 24, 1997
Sold by
Nicholson Brandt
Bought by
Gaylor Susan E
Home Financials for this Owner
Home Financials are based on the most recent Mortgage that was taken out on this home.
Original Mortgage
$168,000
Interest Rate
7.74%
Purchase Details
Closed on
Aug 6, 1996
Sold by
Landauer Eileen S
Bought by
Nicholson Brandt and The Landauer Exchange Trust
Create a Home Valuation Report for This Property
The Home Valuation Report is an in-depth analysis detailing your home's value as well as a comparison with similar homes in the area
Home Values in the Area
Average Home Value in this Area
Purchase History
| Date | Buyer | Sale Price | Title Company |
|---|---|---|---|
| Gaylor Susan | -- | Old Republic Title | |
| Gaylor Susan E | $210,000 | First American Title Co | |
| Nicholson Brandt | -- | First American Title Ins Co |
Source: Public Records
Mortgage History
| Date | Status | Borrower | Loan Amount |
|---|---|---|---|
| Open | Gaylor Susan | $129,700 | |
| Previous Owner | Gaylor Susan E | $168,000 |
Source: Public Records
Tax History
| Year | Tax Paid | Tax Assessment Tax Assessment Total Assessment is a certain percentage of the fair market value that is determined by local assessors to be the total taxable value of land and additions on the property. | Land | Improvement |
|---|---|---|---|---|
| 2025 | $3,532 | $341,990 | $285,004 | $56,986 |
| 2024 | $3,532 | $335,285 | $279,416 | $55,869 |
| 2023 | $3,597 | $328,712 | $273,938 | $54,774 |
| 2022 | $3,523 | $322,267 | $268,567 | $53,700 |
| 2021 | $3,503 | $315,949 | $263,301 | $52,648 |
| 2020 | $3,433 | $312,711 | $260,602 | $52,109 |
| 2019 | $3,323 | $306,581 | $255,493 | $51,088 |
| 2018 | $3,258 | $300,571 | $250,484 | $50,087 |
| 2017 | $3,203 | $294,678 | $245,573 | $49,105 |
| 2016 | $3,209 | $288,901 | $240,758 | $48,143 |
| 2015 | $3,156 | $284,562 | $237,142 | $47,420 |
| 2014 | $3,090 | $278,989 | $232,497 | $46,492 |
Source: Public Records
Map
Nearby Homes
Your Personal Tour Guide
Ask me questions while you tour the home.