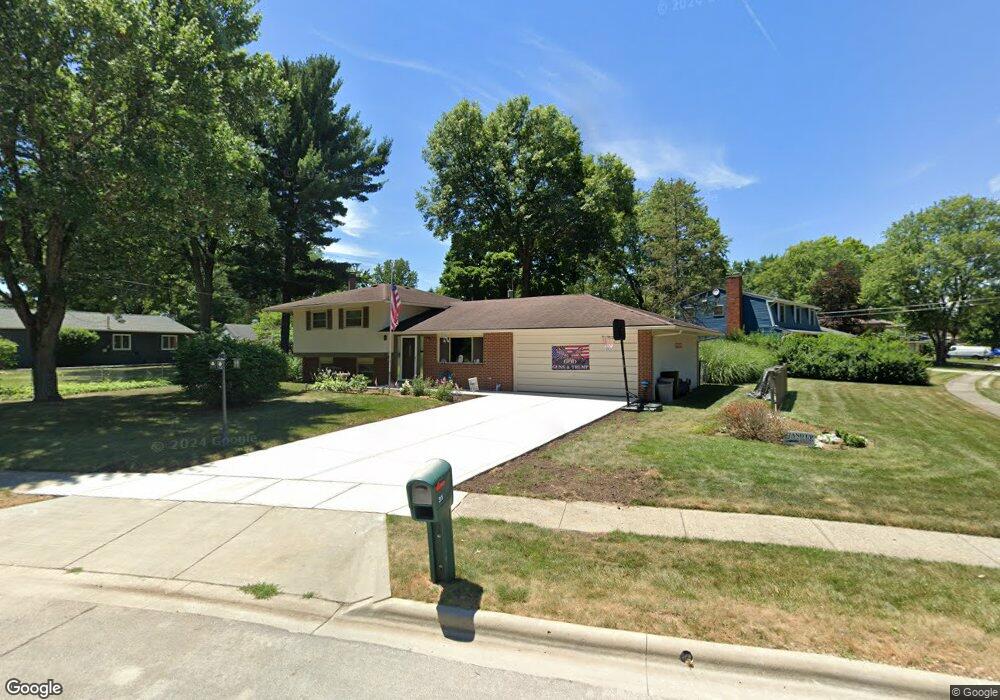
311 Brookhaven Dr E Columbus, OH 43230
Gahanna-Havens Corners NeighborhoodEstimated Value: $328,311 - $350,000
3
Beds
3
Baths
1,596
Sq Ft
$210/Sq Ft
Est. Value
About This Home
This home is located at 311 Brookhaven Dr E, Columbus, OH 43230 and is currently estimated at $335,578, approximately $210 per square foot. 311 Brookhaven Dr E is a home located in Franklin County with nearby schools including Goshen Lane Elementary School, Gahanna West Middle School, and Lincoln High School.
Ownership History
Date
Name
Owned For
Owner Type
Purchase Details
Closed on
Sep 2, 2016
Sold by
Winkler Asa B
Bought by
Starr Kristen L
Current Estimated Value
Home Financials for this Owner
Home Financials are based on the most recent Mortgage that was taken out on this home.
Original Mortgage
$134,400
Outstanding Balance
$106,183
Interest Rate
3.43%
Mortgage Type
New Conventional
Estimated Equity
$229,395
Purchase Details
Closed on
May 30, 2007
Sold by
Beals Bruce B and Beals Roberta L
Bought by
Winkler Asa B
Home Financials for this Owner
Home Financials are based on the most recent Mortgage that was taken out on this home.
Original Mortgage
$144,000
Interest Rate
6.2%
Mortgage Type
Purchase Money Mortgage
Purchase Details
Closed on
May 22, 1989
Bought by
Beals Bruce B
Create a Home Valuation Report for This Property
The Home Valuation Report is an in-depth analysis detailing your home's value as well as a comparison with similar homes in the area
Home Values in the Area
Average Home Value in this Area
Purchase History
| Date | Buyer | Sale Price | Title Company |
|---|---|---|---|
| Starr Kristen L | $168,000 | Northwest Select Title Agenc | |
| Winkler Asa B | $160,000 | Talon Group | |
| Beals Bruce B | $79,900 | -- |
Source: Public Records
Mortgage History
| Date | Status | Borrower | Loan Amount |
|---|---|---|---|
| Open | Starr Kristen L | $134,400 | |
| Previous Owner | Winkler Asa B | $144,000 |
Source: Public Records
Tax History
| Year | Tax Paid | Tax Assessment Tax Assessment Total Assessment is a certain percentage of the fair market value that is determined by local assessors to be the total taxable value of land and additions on the property. | Land | Improvement |
|---|---|---|---|---|
| 2025 | $5,650 | $95,900 | $32,830 | $63,070 |
| 2024 | $5,650 | $95,900 | $32,830 | $63,070 |
| 2023 | $5,579 | $95,900 | $32,830 | $63,070 |
| 2022 | $5,197 | $69,590 | $17,120 | $52,470 |
| 2021 | $5,026 | $69,590 | $17,120 | $52,470 |
| 2020 | $4,984 | $69,590 | $17,120 | $52,470 |
| 2019 | $4,163 | $58,000 | $14,250 | $43,750 |
| 2018 | $3,938 | $58,000 | $14,250 | $43,750 |
| 2017 | $3,780 | $58,000 | $14,250 | $43,750 |
| 2016 | $3,739 | $51,700 | $13,270 | $38,430 |
| 2015 | $3,742 | $51,700 | $13,270 | $38,430 |
| 2014 | $3,713 | $51,700 | $13,270 | $38,430 |
| 2013 | $1,844 | $51,695 | $13,265 | $38,430 |
Source: Public Records
Map
Nearby Homes
- 167 Lansdowne Ave
- 404 Oberlin St
- 300 Dunbarton Rd
- 402 Citadel St
- 84 River Dr
- 258 Rocky Fork Dr S
- 329 Cliffview Dr
- 143 Serran Dr
- 491 Daventry Ln
- 343 Flint Ridge Dr
- 600 Agler Rd
- 209 Prince of Wales Dr
- 206 Lintner St
- 377 Highbury Crescent
- 219 N Hamilton Rd
- 0 E Armuth Ave
- 3832 Emmons Ave
- 2225 Mifflin Blvd
- 0 E Emmons Ave
- 221 Lincolnshire Rd
- 199 Dunbarton Rd
- 184 Lansdowne Ave
- 176 Lansdowne Ave
- 196 Dunbarton Rd
- 194 Lansdowne Ave
- 321 Brookhaven Dr E
- 306 Brookhaven Dr E
- 209 Dunbarton Rd
- 289 Brookhaven Dr E
- 312 Brookhaven Dr E
- 206 Lansdowne Ave
- 290 Brookhaven Dr E
- 208 Dunbarton Rd
- 193 Hermitage Rd
- 183 Lansdowne Ave
- 217 Dunbarton Rd
- 191 Lansdowne Ave
- 284 Brookhaven Dr E
- 214 Dunbarton Rd
- 175 Lansdowne Ave
Your Personal Tour Guide
Ask me questions while you tour the home.