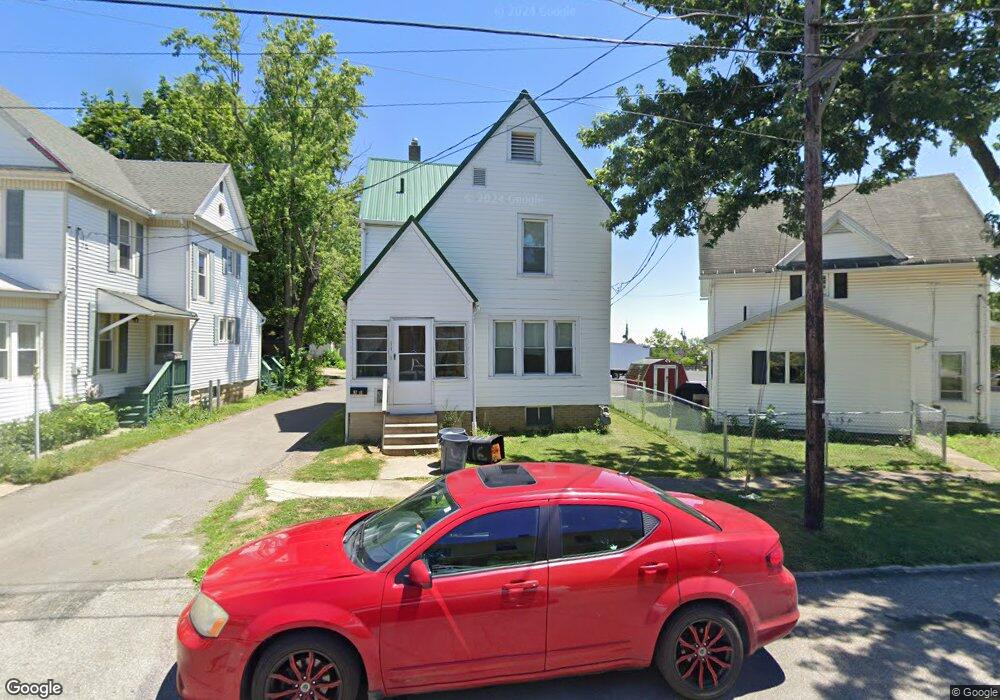
311 Carroll St Ashland, OH 44805
Estimated Value: $107,000 - $147,000
4
Beds
2
Baths
1,340
Sq Ft
$94/Sq Ft
Est. Value
About This Home
This home is located at 311 Carroll St, Ashland, OH 44805 and is currently estimated at $126,373, approximately $94 per square foot. 311 Carroll St is a home located in Ashland County with nearby schools including Ashland High School, Ashland County Community Academy, and St. Edward Elementary School.
Ownership History
Date
Name
Owned For
Owner Type
Purchase Details
Closed on
Oct 8, 2023
Sold by
Moore Billy L and Moore Rachel L
Bought by
Akasha Rentals Llc
Current Estimated Value
Purchase Details
Closed on
Dec 4, 2020
Bought by
Courtney Miszczak
Home Financials for this Owner
Home Financials are based on the most recent Mortgage that was taken out on this home.
Interest Rate
2.71%
Purchase Details
Closed on
Nov 17, 2020
Bought by
Courtney Miszczak
Home Financials for this Owner
Home Financials are based on the most recent Mortgage that was taken out on this home.
Interest Rate
2.71%
Purchase Details
Closed on
Sep 16, 2011
Sold by
Mary Leiter
Bought by
Barber Shannon
Purchase Details
Closed on
Sep 12, 2008
Sold by
Leiter Mary
Bought by
Meluch Kathy Ann and Tobias Brenda Su
Purchase Details
Closed on
Jan 1, 1990
Bought by
Leiter Mary
Create a Home Valuation Report for This Property
The Home Valuation Report is an in-depth analysis detailing your home's value as well as a comparison with similar homes in the area
Home Values in the Area
Average Home Value in this Area
Purchase History
| Date | Buyer | Sale Price | Title Company |
|---|---|---|---|
| Akasha Rentals Llc | -- | Heartland Title | |
| Akasha Rentals Llc | -- | Heartland Title | |
| Courtney Miszczak | $25,000 | -- | |
| Courtney Miszczak | $25,000 | -- | |
| Barber Shannon | $28,500 | -- | |
| Meluch Kathy Ann | -- | -- | |
| Leiter Mary | -- | -- |
Source: Public Records
Mortgage History
| Date | Status | Borrower | Loan Amount |
|---|---|---|---|
| Previous Owner | Barber Shannon | -- | |
| Previous Owner | Barber Shannon | -- |
Source: Public Records
Tax History Compared to Growth
Tax History
| Year | Tax Paid | Tax Assessment Tax Assessment Total Assessment is a certain percentage of the fair market value that is determined by local assessors to be the total taxable value of land and additions on the property. | Land | Improvement |
|---|---|---|---|---|
| 2024 | $945 | $26,630 | $2,600 | $24,030 |
| 2023 | $945 | $26,630 | $2,600 | $24,030 |
| 2022 | $886 | $19,730 | $1,930 | $17,800 |
| 2021 | $890 | $19,730 | $1,930 | $17,800 |
| 2020 | $821 | $19,730 | $1,930 | $17,800 |
| 2019 | $632 | $14,030 | $2,190 | $11,840 |
| 2018 | $638 | $14,030 | $2,190 | $11,840 |
| 2017 | $702 | $14,030 | $2,190 | $11,840 |
| 2016 | $608 | $12,750 | $1,990 | $10,760 |
| 2015 | $602 | $12,750 | $1,990 | $10,760 |
| 2013 | $936 | $18,730 | $1,970 | $16,760 |
Source: Public Records
Map
Nearby Homes