Estimated Value: $335,000 - $466,000
3
Beds
2
Baths
1,202
Sq Ft
$324/Sq Ft
Est. Value
About This Home
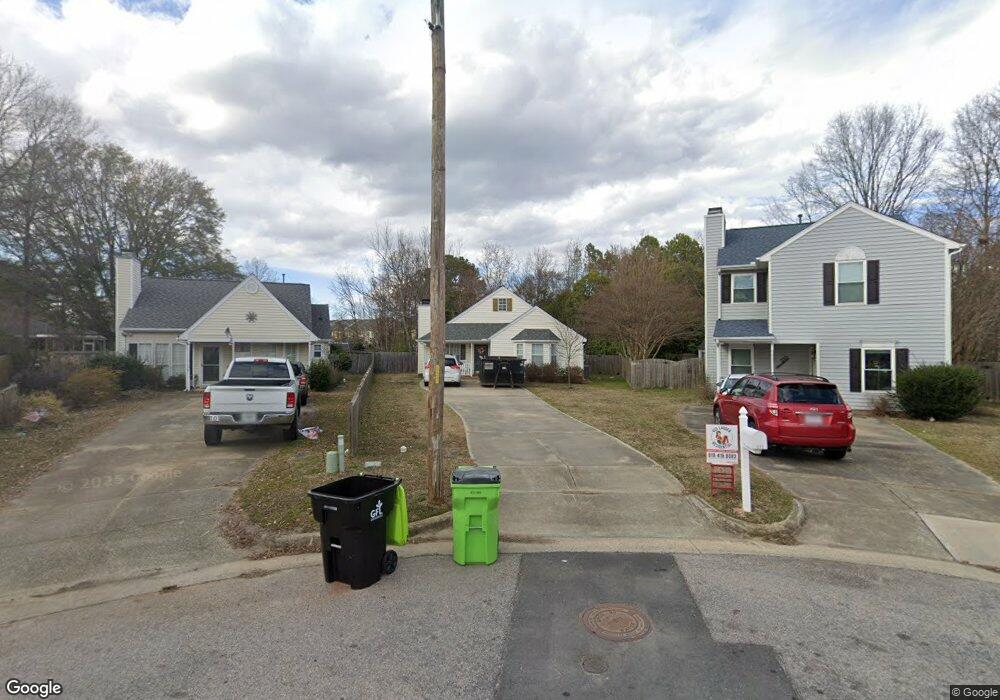
This home is located at 311 Center Park Way, Apex, NC 27502 and is currently estimated at $389,455, approximately $324 per square foot. 311 Center Park Way is a home located in Wake County with nearby schools including Apex Elementary School, Apex Middle, and Apex High School.
Ownership History
Date
Name
Owned For
Owner Type
Purchase Details
Closed on
Dec 16, 2011
Sold by
Jackson Jamie B and Jackson Jeffrey T
Bought by
Jackson Jamie B and Jackson Jeffrey T
Current Estimated Value
Home Financials for this Owner
Home Financials are based on the most recent Mortgage that was taken out on this home.
Original Mortgage
$94,000
Outstanding Balance
$64,457
Interest Rate
4.06%
Mortgage Type
New Conventional
Estimated Equity
$324,998
Purchase Details
Closed on
Dec 9, 2002
Sold by
Basile Maria E
Bought by
Brown Jamie E
Home Financials for this Owner
Home Financials are based on the most recent Mortgage that was taken out on this home.
Original Mortgage
$121,539
Interest Rate
6.08%
Mortgage Type
FHA
Purchase Details
Closed on
Oct 30, 1998
Sold by
Creekmore Creekmore N and Creekmore Alison S
Bought by
Basile Maria E
Home Financials for this Owner
Home Financials are based on the most recent Mortgage that was taken out on this home.
Original Mortgage
$113,000
Interest Rate
6.61%
Create a Home Valuation Report for This Property
The Home Valuation Report is an in-depth analysis detailing your home's value as well as a comparison with similar homes in the area
Home Values in the Area
Average Home Value in this Area
Purchase History
| Date | Buyer | Sale Price | Title Company |
|---|---|---|---|
| Jackson Jamie B | -- | None Available | |
| Brown Jamie E | $122,500 | -- | |
| Basile Maria E | $113,000 | -- |
Source: Public Records
Mortgage History
| Date | Status | Borrower | Loan Amount |
|---|---|---|---|
| Open | Jackson Jamie B | $94,000 | |
| Closed | Brown Jamie E | $121,539 | |
| Previous Owner | Basile Maria E | $113,000 |
Source: Public Records
Tax History Compared to Growth
Tax History
| Year | Tax Paid | Tax Assessment Tax Assessment Total Assessment is a certain percentage of the fair market value that is determined by local assessors to be the total taxable value of land and additions on the property. | Land | Improvement |
|---|---|---|---|---|
| 2025 | $2,781 | $316,173 | $150,000 | $166,173 |
| 2024 | $2,719 | $316,173 | $150,000 | $166,173 |
| 2023 | $2,260 | $204,214 | $74,000 | $130,214 |
| 2022 | $2,122 | $204,214 | $74,000 | $130,214 |
| 2021 | $2,042 | $204,214 | $74,000 | $130,214 |
| 2020 | $2,021 | $204,214 | $74,000 | $130,214 |
| 2019 | $1,750 | $152,313 | $53,000 | $99,313 |
| 2018 | $1,649 | $152,313 | $53,000 | $99,313 |
| 2017 | $1,536 | $152,313 | $53,000 | $99,313 |
| 2016 | $1,513 | $152,313 | $53,000 | $99,313 |
| 2015 | $1,512 | $148,484 | $48,000 | $100,484 |
| 2014 | -- | $148,484 | $48,000 | $100,484 |
Source: Public Records
Map
Nearby Homes
- 311 Culvert St
- 309 Culvert St
- 105 Cunningham St
- 635 Sawcut Ln
- 631 Sawcut Ln
- 633 Sawcut Ln
- 547 Grand Central Station
- 596 Grand Central Station
- 202 W Chatham St
- 307 S Elm St
- 314 Wrenn St
- 1000 Oakgate Ct
- 295 Williams Grove Ln Unit Lot 67
- 285 Williams Grove Ln Unit Lot 65
- 281 Williams Grove Ln Unit Lot 64
- 281 Williams Grove Ln
- 903 Norwood Ln
- 273 Williams Grove Ln Unit Lot 62
- 265 Williams Grove Ln
- 298 Williams Grove Ln N Unit 68
- 309 Center Park Way
- 310 Center Park Way
- 307 Center Park Way
- 310 Keith St
- 308 Center Park Way
- 308 Keith St
- 305 Center Park Way
- 306 Center Park Way
- 525 Old Mill Village Dr
- 306 Keith St
- 527 Old Mill Village Dr
- 523 Old Mill Village Dr
- 521 Old Mill Village Dr
- 303 Center Park Way
- 529 Old Mill Village Dr
- 304 Center Park Way
- 531 Old Mill Village Dr
- 519 Old Mill Village Dr
- 533 Old Mill Village Dr
- 517 Old Mill Village Dr