Estimated Value: $185,000 - $470,000
--
Bed
1
Bath
1,003
Sq Ft
$349/Sq Ft
Est. Value
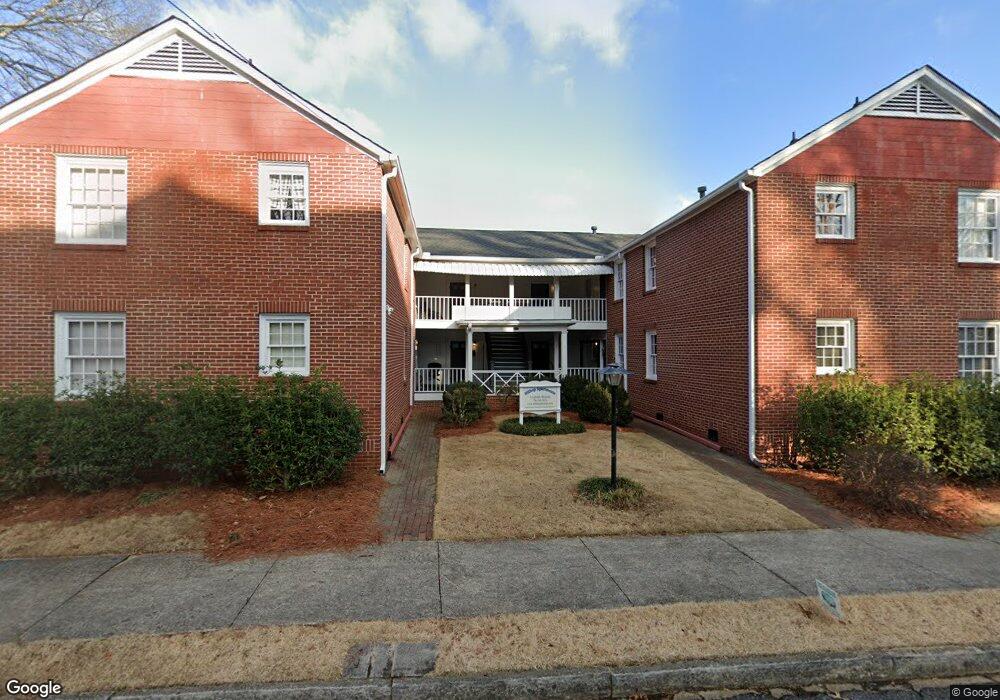
About This Home
This home is located at 311 E 3rd St, Rome, GA 30161 and is currently estimated at $349,922, approximately $348 per square foot. 311 E 3rd St is a home located in Floyd County with nearby schools including Rome High School, St. Mary School, and Darlington School.
Ownership History
Date
Name
Owned For
Owner Type
Purchase Details
Closed on
Jul 11, 1997
Sold by
Summer Lloyd Langston
Bought by
Walstad Martha
Current Estimated Value
Purchase Details
Closed on
Feb 19, 1997
Bought by
P and R
Purchase Details
Closed on
Sep 14, 1989
Sold by
Howell Adrian Trustee Of
Bought by
Summer Lloyd Langston
Purchase Details
Closed on
Jun 30, 1980
Sold by
Howell Adrian
Bought by
Shepherd Adele H and Shepherd Elton W
Purchase Details
Closed on
Mar 30, 1976
Sold by
Bishop Francis M and Bishop Margaret H
Bought by
Howell Adrian
Purchase Details
Closed on
Nov 1, 1967
Sold by
Hilburn W Eugene
Bought by
Bishop Francis M and Bishop Margaret H
Purchase Details
Closed on
Nov 15, 1963
Sold by
Selman Maebelle
Bought by
Hilburn W Eugene
Purchase Details
Closed on
Jan 1, 1962
Sold by
Perry Ray Mrs
Bought by
Selman Maebelle
Purchase Details
Closed on
Jan 1, 1901
Bought by
Perry Ray Mrs
Create a Home Valuation Report for This Property
The Home Valuation Report is an in-depth analysis detailing your home's value as well as a comparison with similar homes in the area
Home Values in the Area
Average Home Value in this Area
Purchase History
| Date | Buyer | Sale Price | Title Company |
|---|---|---|---|
| Walstad Martha | $202,500 | -- | |
| P | -- | -- | |
| Summer Lloyd Langston | $150,000 | -- | |
| Howell Adrian Trustee Of | -- | -- | |
| Shepherd Adele H | $90,000 | -- | |
| Howell Adrian | $67,500 | -- | |
| Bishop Francis M | $55,300 | -- | |
| Hilburn W Eugene | $2,800 | -- | |
| Selman Maebelle | -- | -- | |
| Perry Ray Mrs | -- | -- |
Source: Public Records
Tax History
| Year | Tax Paid | Tax Assessment Tax Assessment Total Assessment is a certain percentage of the fair market value that is determined by local assessors to be the total taxable value of land and additions on the property. | Land | Improvement |
|---|---|---|---|---|
| 2025 | $6,086 | $170,231 | $53,111 | $117,120 |
| 2024 | $6,086 | $168,057 | $53,111 | $114,946 |
| 2023 | $5,952 | $140,885 | $53,111 | $87,774 |
| 2022 | $4,725 | $129,495 | $47,210 | $82,285 |
| 2021 | $4,022 | $108,407 | $47,210 | $61,197 |
| 2020 | $4,044 | $108,083 | $47,210 | $60,873 |
| 2019 | $3,921 | $105,923 | $47,210 | $58,713 |
| 2018 | $3,907 | $105,537 | $47,210 | $58,327 |
| 2017 | $3,900 | $105,337 | $47,210 | $58,127 |
| 2016 | $3,913 | $105,357 | $47,200 | $58,157 |
| 2015 | $3,695 | $105,357 | $47,200 | $58,157 |
| 2014 | $3,695 | $105,357 | $47,200 | $58,157 |
Source: Public Records
Map
Nearby Homes
- 312 E 3rd St
- 202 E 4th Ave Unit 5
- 407 E 3rd St
- 214 E 3rd St
- 204 E 5th Ave
- 501 E 3rd St
- 320 E 3rd Ave
- 10 E 3rd Ave
- 8 E 3rd Ave
- 1 E 3rd Ave Unit 302
- 1 E 3rd Ave
- 29 Pear St
- 633 E 3rd St
- 167 Sweet Water Ln
- 138 E 8th Ave Unit 25
- 0 Brook Valley Ct Unit 10665224
- 0 Brook Valley Ct Unit 7698646
- 2 Coral Ave SW
- 232 S Broad St SW
- 105 Mary St SW
- 300 E 3rd St
- E E 3rd St Unit 14
- E E 3rd St Unit 150
- E E 3rd St
- 340 E 3rd St
- 13 College Ave
- 206 E 4th Ave
- 365 E 3rd St
- 17 College Ave
- 202 E 4th Ave
- 202 E 4th Ave Unit 1
- 202 E 4th Ave Unit 4
- 202 E 4th Ave Unit 3
- 375 E 3rd St
- 350 E 2nd St
- 308 E 2nd St
- 304 E 2nd St
- 18 College Ave
- 200 E 4th Ave
- 20 College Ave
Your Personal Tour Guide
Ask me questions while you tour the home.