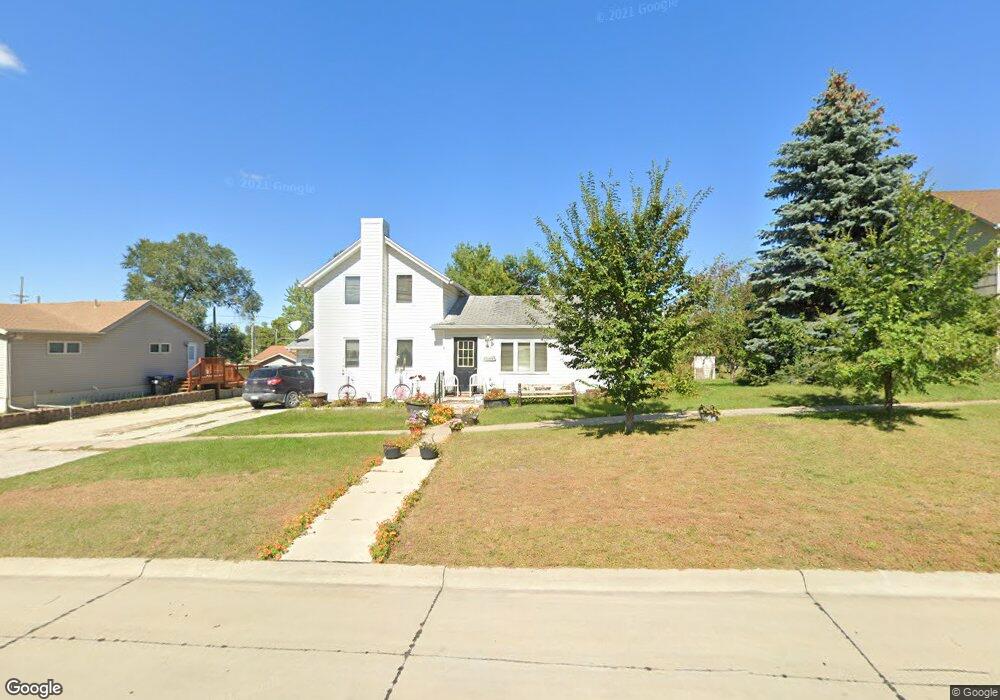
311 E 3rd St Vinton, IA 52349
Estimated Value: $126,409 - $184,000
4
Beds
1
Bath
1,683
Sq Ft
$94/Sq Ft
Est. Value
About This Home
This home is located at 311 E 3rd St, Vinton, IA 52349 and is currently estimated at $157,602, approximately $93 per square foot. 311 E 3rd St is a home located in Benton County with nearby schools including Tilford Elementary School, Vinton-Shellsburg Middle School, and Vinton-Shellsburg High School.
Ownership History
Date
Name
Owned For
Owner Type
Purchase Details
Closed on
Feb 17, 2022
Sold by
Long James E and Long Martha S
Bought by
Long Ronald C
Current Estimated Value
Home Financials for this Owner
Home Financials are based on the most recent Mortgage that was taken out on this home.
Original Mortgage
$37,100
Outstanding Balance
$29,758
Interest Rate
3.15%
Estimated Equity
$127,844
Create a Home Valuation Report for This Property
The Home Valuation Report is an in-depth analysis detailing your home's value as well as a comparison with similar homes in the area
Home Values in the Area
Average Home Value in this Area
Purchase History
| Date | Buyer | Sale Price | Title Company |
|---|---|---|---|
| Long Ronald C | $32,000 | None Listed On Document |
Source: Public Records
Mortgage History
| Date | Status | Borrower | Loan Amount |
|---|---|---|---|
| Open | Long Ronald C | $37,100 |
Source: Public Records
Tax History
| Year | Tax Paid | Tax Assessment Tax Assessment Total Assessment is a certain percentage of the fair market value that is determined by local assessors to be the total taxable value of land and additions on the property. | Land | Improvement |
|---|---|---|---|---|
| 2025 | $1,324 | $110,400 | $14,800 | $95,600 |
| 2024 | $1,324 | $103,000 | $14,200 | $88,800 |
| 2023 | $1,524 | $103,000 | $14,200 | $88,800 |
| 2022 | $1,562 | $79,700 | $11,300 | $68,400 |
| 2021 | $1,562 | $79,700 | $11,300 | $68,400 |
| 2020 | $1,658 | $85,400 | $10,200 | $75,200 |
| 2019 | $1,566 | $85,400 | $10,200 | $75,200 |
| 2018 | $1,518 | $82,900 | $9,700 | $73,200 |
| 2017 | $1,518 | $80,000 | $9,700 | $70,300 |
| 2016 | $1,426 | $74,800 | $9,100 | $65,700 |
| 2015 | $1,479 | $74,800 | $9,100 | $65,700 |
| 2014 | $1,396 | $73,300 | $0 | $0 |
Source: Public Records
Map
Nearby Homes
Your Personal Tour Guide
Ask me questions while you tour the home.