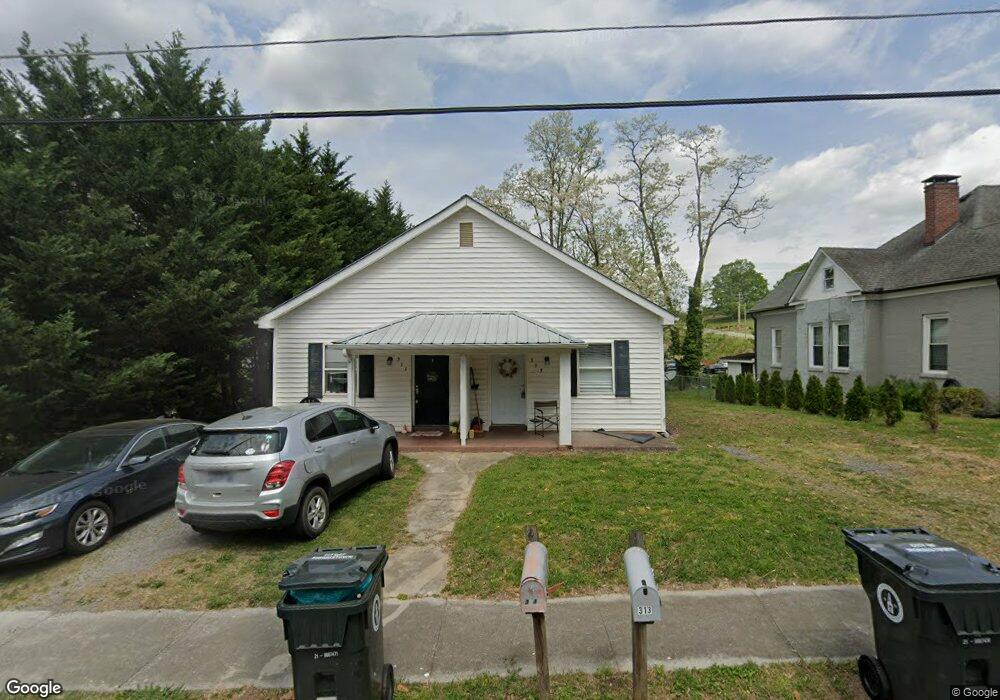
311 E 4th North St Morristown, TN 37814
Estimated Value: $162,124 - $288,000
--
Bed
2
Baths
1,850
Sq Ft
$113/Sq Ft
Est. Value
About This Home
This home is located at 311 E 4th North St, Morristown, TN 37814 and is currently estimated at $209,041, approximately $112 per square foot. 311 E 4th North St is a home located in Hamblen County with nearby schools including Hillcrest Elementary School, Meadowview Middle School, and Morristown East High School.
Ownership History
Date
Name
Owned For
Owner Type
Purchase Details
Closed on
May 1, 2015
Sold by
Collake Jimmy
Bought by
Douglas Valley Lp
Current Estimated Value
Purchase Details
Closed on
May 21, 2012
Sold by
Mcdavid Stewart
Bought by
Collake Jimmy and Collake Maureen
Purchase Details
Closed on
May 2, 2012
Sold by
Fsgbank Na
Bought by
Rogers James L and Mcdavid Stewart
Purchase Details
Closed on
Nov 14, 2011
Sold by
Talley Dennis Wayne
Bought by
Fsgbank Na
Purchase Details
Closed on
May 17, 2002
Bought by
Rhodes Ethel Laws and Rhodes Denver Lewis
Purchase Details
Closed on
May 30, 1996
Sold by
Wolfe Dale
Bought by
William Laws H
Purchase Details
Closed on
Oct 17, 1988
Bought by
Wolfe Dale and Hatcher Maurice J D
Purchase Details
Closed on
Jul 1, 1988
Bought by
Hull Margaret M
Purchase Details
Closed on
Sep 10, 1981
Bought by
Dixon Richard J and Dixon Margaret M
Create a Home Valuation Report for This Property
The Home Valuation Report is an in-depth analysis detailing your home's value as well as a comparison with similar homes in the area
Home Values in the Area
Average Home Value in this Area
Purchase History
| Date | Buyer | Sale Price | Title Company |
|---|---|---|---|
| Douglas Valley Lp | $33,000 | -- | |
| Collake Jimmy | $27,000 | -- | |
| Rogers James L | $16,500 | -- | |
| Fsgbank Na | $38,280 | -- | |
| Rhodes Ethel Laws | -- | -- | |
| William Laws H | $40,000 | -- | |
| Wolfe Dale | $27,000 | -- | |
| Hull Margaret M | -- | -- | |
| Dixon Richard J | -- | -- |
Source: Public Records
Tax History Compared to Growth
Tax History
| Year | Tax Paid | Tax Assessment Tax Assessment Total Assessment is a certain percentage of the fair market value that is determined by local assessors to be the total taxable value of land and additions on the property. | Land | Improvement |
|---|---|---|---|---|
| 2024 | $572 | $32,480 | $4,480 | $28,000 |
| 2023 | $572 | $32,480 | $0 | $0 |
| 2022 | $1,027 | $32,480 | $4,480 | $28,000 |
| 2021 | $1,027 | $32,480 | $4,480 | $28,000 |
| 2020 | $1,025 | $32,480 | $4,480 | $28,000 |
| 2019 | $1,042 | $30,640 | $4,480 | $26,160 |
| 2018 | $965 | $30,640 | $4,480 | $26,160 |
| 2017 | $950 | $30,640 | $4,480 | $26,160 |
| 2016 | $907 | $30,640 | $4,480 | $26,160 |
| 2015 | $844 | $30,640 | $4,480 | $26,160 |
| 2014 | -- | $30,640 | $4,480 | $26,160 |
| 2013 | -- | $20,000 | $0 | $0 |
Source: Public Records
Map
Nearby Homes
- 311 E 4th St N
- 215 E 5th St N
- 400 E 4th St N
- 120 E 5th North St
- 207 E 2nd St N
- 118 E 3rd St N
- 721 E 1st North St
- 721 E 1st St N
- 2078 Edgewater Sound Rd
- 637 Carriger St
- 529 N Jackson St
- 926 E Main St
- 435 S Hill St
- 1126 E 2nd St N
- 219 Inman St
- 1215 Shields Ferry Rd
- 1323 Goodson Ave
- 912 N Church St
- 106 King Ave
- 722 W 2nd St N
- 319 E 4th North St
- 319 4th St N
- 303 E 4th North St
- 514 N Daisy St
- 329 E 4th North St
- 312 E 4th North St
- 320 E 4th St N
- 320 4th St N
- 320 E 4th North St
- 507 N Daisy St
- 328 E 4th North St
- 429 N Daisy St
- 400 E 4th North St
- 408 E 4th North St
- 419 N Daisy St
- 520 N James St
- 325 E 3rd North St
- 405 E 4th North St
- 313 E 3rd North St
- 415 N Daisy St