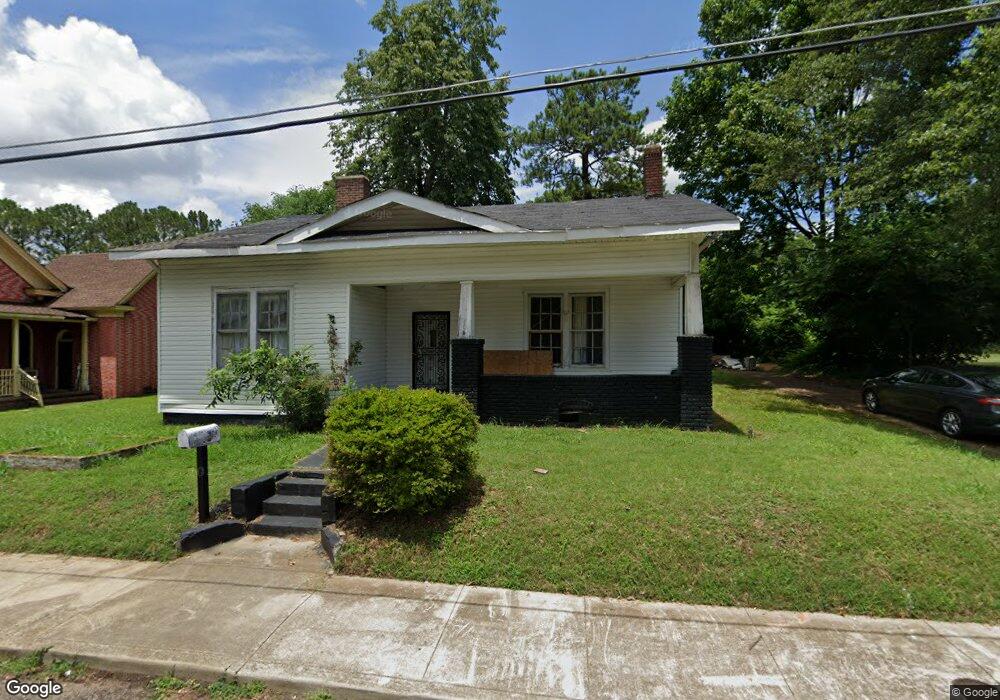
311 E Deaderick St Jackson, TN 38301
Downtown Jackson NeighborhoodEstimated Value: $52,000 - $70,000
2
Beds
1
Bath
1,380
Sq Ft
$43/Sq Ft
Est. Value
About This Home
This home is located at 311 E Deaderick St, Jackson, TN 38301 and is currently estimated at $58,904, approximately $42 per square foot. 311 E Deaderick St is a home located in Madison County with nearby schools including Isaac Lane Technology Magnet Elementary School and Liberty Technology Magnet High School.
Ownership History
Date
Name
Owned For
Owner Type
Purchase Details
Closed on
Oct 18, 2018
Sold by
Boyd Juricus C
Bought by
Miller Jonathan
Current Estimated Value
Purchase Details
Closed on
Nov 28, 2017
Sold by
Carter Pam
Bought by
Boyd Juricus
Purchase Details
Closed on
Apr 4, 2013
Sold by
Goodman Jimmy Lee
Bought by
Perkins Joella
Purchase Details
Closed on
Aug 17, 2011
Sold by
Tate Sethicia L
Bought by
Goodman Jimmy Lee
Purchase Details
Closed on
Sep 7, 2004
Sold by
First Tennessee Bank
Bought by
Tate Sethicia L
Purchase Details
Closed on
Jan 24, 1990
Bought by
Fowler Glenn H
Purchase Details
Closed on
Jun 1, 1989
Bought by
Johnson Nathan L
Purchase Details
Closed on
Jun 1, 1988
Bought by
Secretary Of Housing
Purchase Details
Closed on
May 20, 1988
Bought by
Leader Federal S & L
Purchase Details
Closed on
Dec 3, 1985
Purchase Details
Closed on
Dec 11, 1984
Create a Home Valuation Report for This Property
The Home Valuation Report is an in-depth analysis detailing your home's value as well as a comparison with similar homes in the area
Home Values in the Area
Average Home Value in this Area
Purchase History
| Date | Buyer | Sale Price | Title Company |
|---|---|---|---|
| Miller Jonathan | $6,500 | None Available | |
| Boyd Juricus | $1,081 | None Available | |
| Perkins Joella | $5,000 | -- | |
| Goodman Jimmy Lee | $4,000 | -- | |
| Tate Sethicia L | $6,000 | -- | |
| Fowler Glenn H | $21,700 | -- | |
| Johnson Nathan L | $10,800 | -- | |
| Secretary Of Housing | -- | -- | |
| Leader Federal S & L | -- | -- | |
| -- | -- | -- | |
| -- | -- | -- |
Source: Public Records
Tax History
| Year | Tax Paid | Tax Assessment Tax Assessment Total Assessment is a certain percentage of the fair market value that is determined by local assessors to be the total taxable value of land and additions on the property. | Land | Improvement |
|---|---|---|---|---|
| 2025 | $225 | $12,000 | $1,150 | $10,850 |
| 2024 | $225 | $12,000 | $1,150 | $10,850 |
| 2022 | $418 | $12,000 | $1,150 | $10,850 |
| 2021 | $378 | $8,775 | $1,025 | $7,750 |
| 2020 | $378 | $8,775 | $1,025 | $7,750 |
| 2019 | $378 | $8,775 | $1,025 | $7,750 |
| 2018 | $378 | $8,775 | $1,025 | $7,750 |
| 2017 | $360 | $8,150 | $1,025 | $7,125 |
| 2016 | $388 | $9,425 | $1,025 | $8,400 |
| 2015 | $388 | $9,425 | $1,025 | $8,400 |
| 2014 | $388 | $9,425 | $1,025 | $8,400 |
Source: Public Records
Map
Nearby Homes
- 521 N Hays Ave
- 431 N Hays Ave
- 124 Taylor St
- 431 Preston St
- HWY 18 Jackson St
- 169 Dupree St
- 160 Tomlin St
- 243 Oak St
- 676 N Hays Ave
- 130 Elizabeth St
- 132 Elizabeth St
- 420 Lexington Ave
- 329 N Lindsey St
- 327 N Lindsey St
- 559 N Cumberland St
- 115 Neff St
- 513 Preston St
- 554 E Main St
- 564 E Main St
- 547 E Baltimore St
- 311 E Deadrick St
- 303 E Deadrick St
- 214 Stoddert St
- 319 E Deadrick St
- 316 E Deadrick St
- 220 Stoddert St
- 302 E Deadrick St
- 310 E Deadrick St
- 333 E Deadrick St
- 163 Gates St
- 224 Stoddert St
- 328 E Deadrick St
- 328 E Deaderick St
- 230 Stoddert St
- 151 Gates St
- 335 E Deadrick St
- 160 Gates St
- 138 Lee St
- 339 E Deadrick St
- 158 Gates St
Your Personal Tour Guide
Ask me questions while you tour the home.