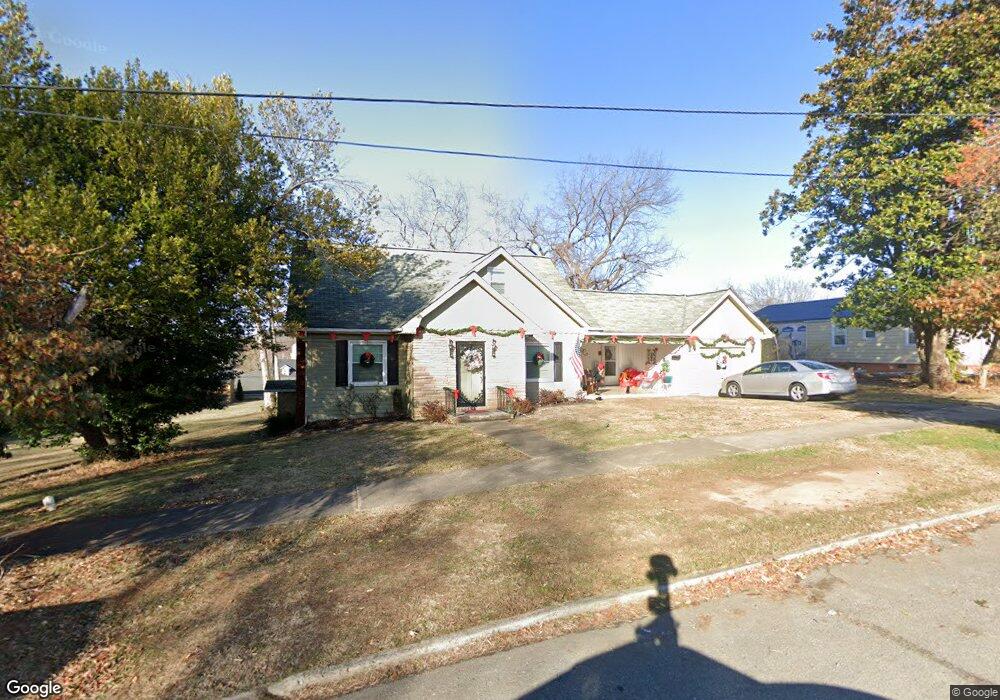
311 E I St Elizabethton, TN 37643
Estimated Value: $137,000 - $328,000
--
Bed
1
Bath
2,464
Sq Ft
$105/Sq Ft
Est. Value
About This Home
This home is located at 311 E I St, Elizabethton, TN 37643 and is currently estimated at $257,651, approximately $104 per square foot. 311 E I St is a home with nearby schools including Elizabethton High School and East Tn Christian Home & Academy.
Ownership History
Date
Name
Owned For
Owner Type
Purchase Details
Closed on
Jun 8, 2011
Bought by
Simmons Lewis Keith E Christopher
Current Estimated Value
Home Financials for this Owner
Home Financials are based on the most recent Mortgage that was taken out on this home.
Original Mortgage
$50,000
Interest Rate
4.91%
Mortgage Type
Commercial
Purchase Details
Closed on
Dec 2, 2009
Bought by
Simmons Christopher L Keith E Lewis
Purchase Details
Closed on
Feb 23, 1951
Bought by
Lewis Ruby
Purchase Details
Closed on
May 20, 1947
Create a Home Valuation Report for This Property
The Home Valuation Report is an in-depth analysis detailing your home's value as well as a comparison with similar homes in the area
Home Values in the Area
Average Home Value in this Area
Purchase History
| Date | Buyer | Sale Price | Title Company |
|---|---|---|---|
| Simmons Lewis Keith E Christopher | $50,000 | -- | |
| Simmons Christopher L | $5,000 | -- | |
| Simmons Christopher L Keith E Lewis | $45,000 | -- | |
| Lewis Ruby | -- | -- | |
| -- | -- | -- |
Source: Public Records
Mortgage History
| Date | Status | Borrower | Loan Amount |
|---|---|---|---|
| Previous Owner | Simmons Christopher L | $50,000 |
Source: Public Records
Tax History Compared to Growth
Tax History
| Year | Tax Paid | Tax Assessment Tax Assessment Total Assessment is a certain percentage of the fair market value that is determined by local assessors to be the total taxable value of land and additions on the property. | Land | Improvement |
|---|---|---|---|---|
| 2024 | $1,448 | $43,900 | $16,600 | $27,300 |
| 2023 | $1,448 | $43,900 | $0 | $0 |
| 2022 | $1,552 | $43,125 | $16,600 | $26,525 |
| 2021 | $875 | $43,125 | $16,600 | $26,525 |
| 2020 | $1,096 | $43,125 | $16,600 | $26,525 |
| 2019 | $1,096 | $25,375 | $8,675 | $16,700 |
| 2018 | $1,081 | $25,375 | $8,675 | $16,700 |
| 2017 | $1,081 | $25,375 | $8,675 | $16,700 |
| 2016 | $1,076 | $25,375 | $8,675 | $16,700 |
| 2015 | $1,078 | $25,375 | $8,675 | $16,700 |
| 2014 | $1,077 | $25,225 | $8,675 | $16,550 |
Source: Public Records
Map
Nearby Homes