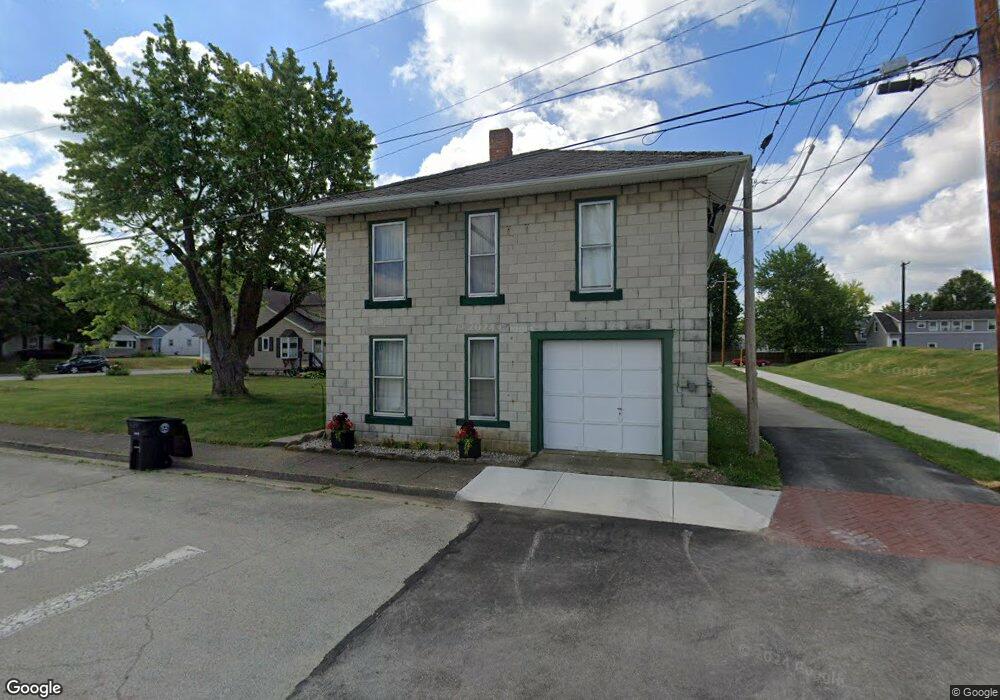
311 E Maple St Covington, OH 45318
Estimated Value: $130,000 - $176,000
2
Beds
1
Bath
2,016
Sq Ft
$73/Sq Ft
Est. Value
About This Home
This home is located at 311 E Maple St, Covington, OH 45318 and is currently estimated at $146,441, approximately $72 per square foot. 311 E Maple St is a home located in Miami County with nearby schools including Covington Elementary/Junior High School, Covington Junior High School, and Covington High School.
Ownership History
Date
Name
Owned For
Owner Type
Purchase Details
Closed on
Apr 8, 2016
Sold by
Kimmel Ray A
Bought by
Village Of Covington Ohio
Current Estimated Value
Purchase Details
Closed on
Dec 1, 2011
Sold by
Kimmel Stephanie A
Bought by
Kimmel Ray A
Purchase Details
Closed on
Nov 13, 2008
Sold by
Hud
Bought by
Kimmel Stephanie A and Kimmel Ray A
Purchase Details
Closed on
Apr 16, 2008
Sold by
Brewer Adam and Brewer Adam C
Bought by
Hud
Purchase Details
Closed on
May 2, 2003
Sold by
Hall Joyce A
Bought by
Brewer Adam C and Brewer Jessie L
Home Financials for this Owner
Home Financials are based on the most recent Mortgage that was taken out on this home.
Original Mortgage
$72,674
Interest Rate
5.86%
Mortgage Type
FHA
Purchase Details
Closed on
Jan 1, 1990
Bought by
Hall Joyce A
Create a Home Valuation Report for This Property
The Home Valuation Report is an in-depth analysis detailing your home's value as well as a comparison with similar homes in the area
Home Values in the Area
Average Home Value in this Area
Purchase History
| Date | Buyer | Sale Price | Title Company |
|---|---|---|---|
| Village Of Covington Ohio | $300 | None Available | |
| Kimmel Ray A | -- | -- | |
| Kimmel Stephanie A | -- | -- | |
| Hud | -- | -- | |
| Brewer Adam C | $73,500 | -- | |
| Hall Joyce A | -- | -- |
Source: Public Records
Mortgage History
| Date | Status | Borrower | Loan Amount |
|---|---|---|---|
| Previous Owner | Brewer Adam C | $72,674 |
Source: Public Records
Tax History
| Year | Tax Paid | Tax Assessment Tax Assessment Total Assessment is a certain percentage of the fair market value that is determined by local assessors to be the total taxable value of land and additions on the property. | Land | Improvement |
|---|---|---|---|---|
| 2025 | $910 | $27,230 | $9,660 | $17,570 |
| 2024 | $910 | $18,940 | $10,470 | $8,470 |
| 2023 | $726 | $18,940 | $10,470 | $8,470 |
| 2022 | $724 | $18,940 | $10,470 | $8,470 |
| 2021 | $600 | $14,560 | $8,050 | $6,510 |
| 2020 | $602 | $14,560 | $8,050 | $6,510 |
| 2019 | $604 | $14,560 | $8,050 | $6,510 |
| 2018 | $517 | $12,430 | $5,640 | $6,790 |
| 2017 | $526 | $12,430 | $5,640 | $6,790 |
| 2016 | $520 | $12,430 | $5,640 | $6,790 |
| 2015 | $482 | $12,010 | $5,460 | $6,550 |
| 2014 | $482 | $12,010 | $5,460 | $6,550 |
| 2013 | $466 | $12,010 | $5,460 | $6,550 |
Source: Public Records
Map
Nearby Homes
- 39 N Ludlow St
- 37 N Ludlow St
- 27 N Ludlow St
- 96 N Ludlow St
- 94 N Ludlow St
- 102 N Ludlow St
- 38 N Ludlow St
- 25 N Ludlow St
- 26 N Ludlow St
- 108 N Ludlow St
- 24 N Grant St
- 116 N Grant St
- 11 N Ludlow St
- 105 N Ludlow St
- 114 N Ludlow St
- 39 N Wenrick St
- 16 N Grant St
- 101 N Wenrick St
- 37 N Wenrick St
- 120 N Grant St
Your Personal Tour Guide
Ask me questions while you tour the home.