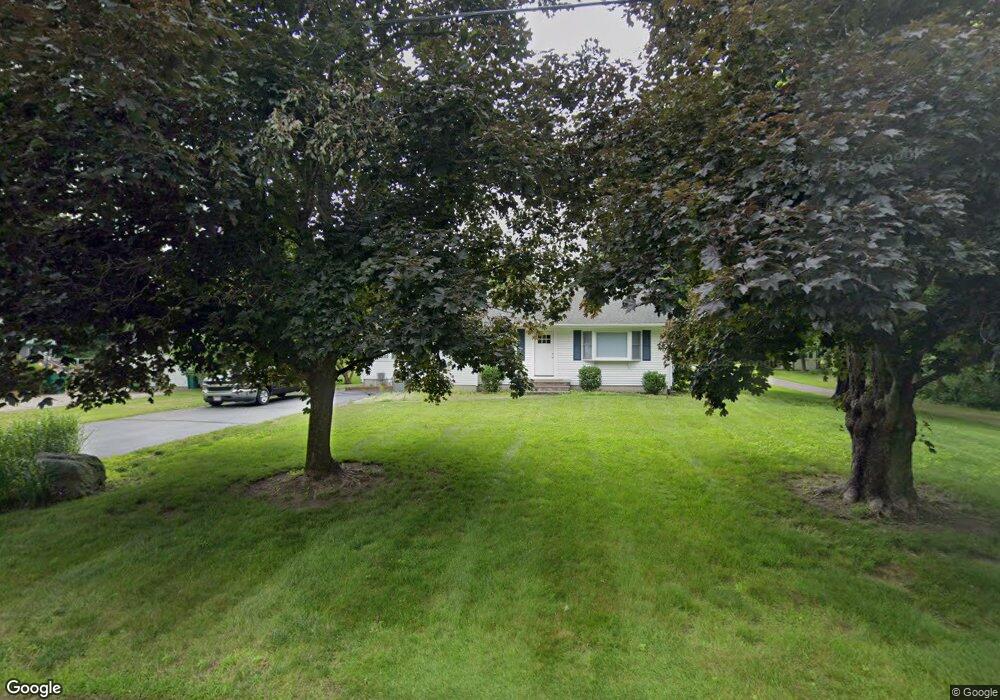
311 Elm Terrace Mansfield, MA 02048
Estimated Value: $601,185 - $639,000
3
Beds
2
Baths
1,336
Sq Ft
$460/Sq Ft
Est. Value
About This Home
This home is located at 311 Elm Terrace, Mansfield, MA 02048 and is currently estimated at $614,296, approximately $459 per square foot. 311 Elm Terrace is a home located in Bristol County with nearby schools including Everett W. Robinson Elementary School, Jordan/Jackson Elementary School, and Harold L. Qualters Middle School.
Ownership History
Date
Name
Owned For
Owner Type
Purchase Details
Closed on
Mar 29, 2021
Sold by
Fitzpatrick Kevin M and Fitzpatrick Michaela A
Bought by
Fitzpatrick Kevin M
Current Estimated Value
Purchase Details
Closed on
May 4, 2010
Sold by
Eagan Ft
Bought by
Fitzpatrick Michaela A and Fitzpatrick Kevin M
Home Financials for this Owner
Home Financials are based on the most recent Mortgage that was taken out on this home.
Original Mortgage
$231,920
Interest Rate
4.99%
Mortgage Type
Purchase Money Mortgage
Create a Home Valuation Report for This Property
The Home Valuation Report is an in-depth analysis detailing your home's value as well as a comparison with similar homes in the area
Home Values in the Area
Average Home Value in this Area
Purchase History
| Date | Buyer | Sale Price | Title Company |
|---|---|---|---|
| Fitzpatrick Kevin M | -- | None Available | |
| Fitzpatrick Michaela A | $289,900 | -- | |
| Fitzpatrick Michaela A | -- | -- |
Source: Public Records
Mortgage History
| Date | Status | Borrower | Loan Amount |
|---|---|---|---|
| Previous Owner | Fitzpatrick Michaela A | $231,920 |
Source: Public Records
Tax History
| Year | Tax Paid | Tax Assessment Tax Assessment Total Assessment is a certain percentage of the fair market value that is determined by local assessors to be the total taxable value of land and additions on the property. | Land | Improvement |
|---|---|---|---|---|
| 2025 | $6,894 | $523,500 | $255,300 | $268,200 |
| 2024 | $6,233 | $461,700 | $243,900 | $217,800 |
| 2023 | $6,160 | $437,200 | $243,900 | $193,300 |
| 2022 | $5,957 | $392,700 | $226,200 | $166,500 |
| 2021 | $0 | $381,900 | $214,700 | $167,200 |
| 2020 | $5,390 | $350,900 | $188,300 | $162,600 |
| 2019 | $0 | $349,700 | $179,400 | $170,300 |
| 2018 | $5,032 | $323,200 | $171,500 | $151,700 |
| 2017 | $3,924 | $326,200 | $166,700 | $159,500 |
| 2016 | $4,831 | $313,500 | $158,700 | $154,800 |
| 2015 | $4,500 | $290,300 | $158,700 | $131,600 |
Source: Public Records
Map
Nearby Homes
- 14 Claire Ave
- 2 Oak St Unit 2B
- 150 Gilbert St
- 451R Gilbert St
- 71 Richardson Ave
- 128 Tremont St
- 250 Mansfield Ave Unit 11
- 49 Pheasant Hill Rd
- 343 Godfrey Dr
- 143 Oak St Unit 10
- 24 Maverick Dr
- 10 Walter St
- 1769 West St
- 157 Mansfield Ave Unit 27
- 157 Mansfield Ave Unit 14
- 345 Richardson Ave
- 5 Village Way Unit C
- 20 John F. Kennedy Dr
- 19 Barberry Rd
- 4 Village Way Unit F
Your Personal Tour Guide
Ask me questions while you tour the home.