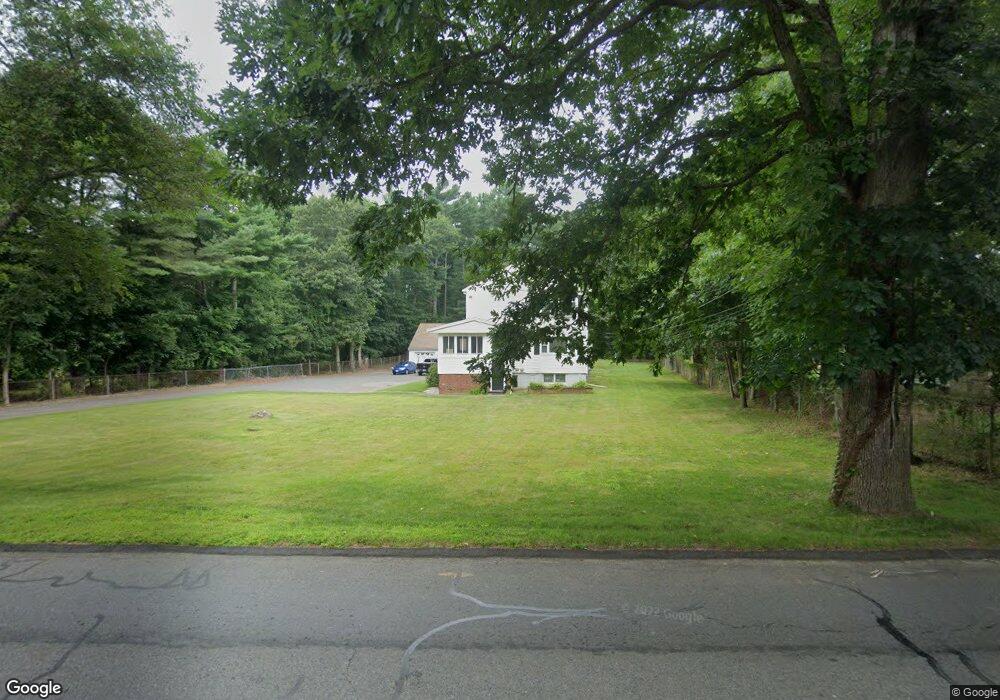
311 Flagg St Unit 2 Bridgewater, MA 02324
Estimated Value: $699,639 - $806,000
2
Beds
1
Bath
1,200
Sq Ft
$622/Sq Ft
Est. Value
About This Home
This home is located at 311 Flagg St Unit 2, Bridgewater, MA 02324 and is currently estimated at $746,910, approximately $622 per square foot. 311 Flagg St Unit 2 is a home located in Plymouth County with nearby schools including Mitchell Elementary School, Williams Intermediate School, and Bridgewater Middle School.
Ownership History
Date
Name
Owned For
Owner Type
Purchase Details
Closed on
Nov 19, 2015
Sold by
Macneill Kevin M and Macneill Erin M
Bought by
Macneill Kevin M and Macneill Erin M
Current Estimated Value
Purchase Details
Closed on
May 27, 2010
Sold by
Brown Rt
Bought by
Macneill Kevin M and Young Erin M
Home Financials for this Owner
Home Financials are based on the most recent Mortgage that was taken out on this home.
Original Mortgage
$325,564
Interest Rate
5.37%
Mortgage Type
FHA
Create a Home Valuation Report for This Property
The Home Valuation Report is an in-depth analysis detailing your home's value as well as a comparison with similar homes in the area
Home Values in the Area
Average Home Value in this Area
Purchase History
| Date | Buyer | Sale Price | Title Company |
|---|---|---|---|
| Macneill Kevin M | -- | -- | |
| Macneill Kevin M | $330,000 | -- |
Source: Public Records
Mortgage History
| Date | Status | Borrower | Loan Amount |
|---|---|---|---|
| Previous Owner | Macneill Kevin M | $325,564 |
Source: Public Records
Tax History Compared to Growth
Tax History
| Year | Tax Paid | Tax Assessment Tax Assessment Total Assessment is a certain percentage of the fair market value that is determined by local assessors to be the total taxable value of land and additions on the property. | Land | Improvement |
|---|---|---|---|---|
| 2025 | $7,598 | $642,300 | $190,700 | $451,600 |
| 2024 | $7,369 | $607,000 | $181,600 | $425,400 |
| 2023 | $7,352 | $572,600 | $169,700 | $402,900 |
| 2022 | $7,220 | $504,200 | $148,900 | $355,300 |
| 2021 | $6,570 | $453,700 | $132,900 | $320,800 |
| 2020 | $6,444 | $437,500 | $127,800 | $309,700 |
| 2019 | $6,344 | $427,800 | $127,800 | $300,000 |
| 2018 | $6,015 | $396,000 | $124,100 | $271,900 |
| 2017 | $5,784 | $370,500 | $124,100 | $246,400 |
| 2016 | $5,534 | $356,100 | $121,700 | $234,400 |
| 2015 | $5,546 | $341,500 | $118,100 | $223,400 |
| 2014 | $5,408 | $332,800 | $114,700 | $218,100 |
Source: Public Records
Map
Nearby Homes
- 489 Flagg St
- 0 Flagg St Unit 73421818
- 9 Titicut Ave
- 218 Auburn St
- 1075 South St
- 220 Bedford St Unit D-5
- 32 Titicut Ave Unit Lot 48
- 50 Stephanie Ln
- 41 Titicut Ave
- 317 Water St
- 35 Leonard St Unit 35
- 29 Leonard St Unit 29
- The Beacon Plan at Duxburrow Estates
- The Nottingham Plan at Duxburrow Estates
- The Lexington Plan at Duxburrow Estates
- The Allcot Plan at Duxburrow Estates
- The Camden Plan at Duxburrow Estates
- The Tacoma Plan at Duxburrow Estates
- The Fenway Plan at Duxburrow Estates
- The Newton Grand Plan at Duxburrow Estates