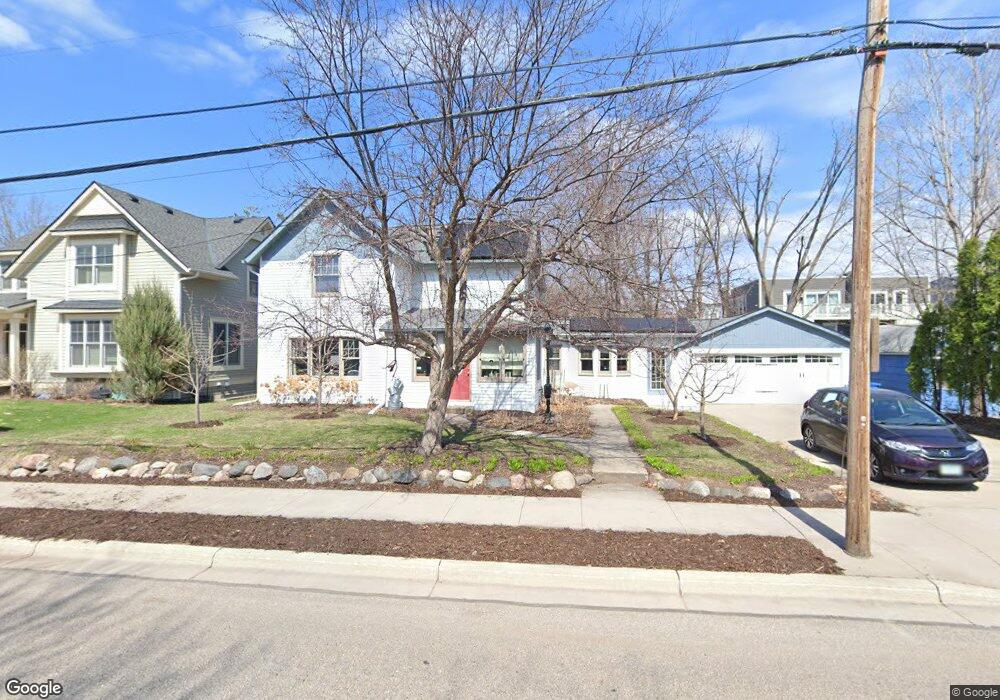
311 George St Excelsior, MN 55331
Estimated Value: $810,931 - $1,600,000
3
Beds
3
Baths
2,351
Sq Ft
$518/Sq Ft
Est. Value
About This Home
This home is located at 311 George St, Excelsior, MN 55331 and is currently estimated at $1,218,733, approximately $518 per square foot. 311 George St is a home located in Hennepin County with nearby schools including Excelsior Elementary School, Minnetonka West Middle School, and Minnetonka Senior High School.
Ownership History
Date
Name
Owned For
Owner Type
Purchase Details
Closed on
Oct 29, 2020
Sold by
Zais Brian P and Zais Karen E
Bought by
Zais Brian Philip and Zais Karen Elizabeth
Current Estimated Value
Purchase Details
Closed on
Sep 26, 2011
Sold by
Nordeen David R and Nordeen Rhonda L
Bought by
Zais Brian P and Zais Karen E
Home Financials for this Owner
Home Financials are based on the most recent Mortgage that was taken out on this home.
Original Mortgage
$175,000
Outstanding Balance
$120,102
Interest Rate
4.23%
Mortgage Type
New Conventional
Estimated Equity
$1,098,631
Create a Home Valuation Report for This Property
The Home Valuation Report is an in-depth analysis detailing your home's value as well as a comparison with similar homes in the area
Home Values in the Area
Average Home Value in this Area
Purchase History
| Date | Buyer | Sale Price | Title Company |
|---|---|---|---|
| Zais Brian Philip | -- | None Available | |
| Zais Brian P | $350,000 | Edina Realty Title Inc |
Source: Public Records
Mortgage History
| Date | Status | Borrower | Loan Amount |
|---|---|---|---|
| Open | Zais Brian P | $175,000 |
Source: Public Records
Tax History
| Year | Tax Paid | Tax Assessment Tax Assessment Total Assessment is a certain percentage of the fair market value that is determined by local assessors to be the total taxable value of land and additions on the property. | Land | Improvement |
|---|---|---|---|---|
| 2024 | $9,856 | $773,000 | $481,800 | $291,200 |
| 2023 | $9,527 | $770,100 | $481,800 | $288,300 |
| 2022 | $6,794 | $618,000 | $349,000 | $269,000 |
| 2021 | $6,492 | $518,000 | $299,000 | $219,000 |
| 2020 | $6,140 | $499,000 | $290,000 | $209,000 |
| 2019 | $6,098 | $457,000 | $263,000 | $194,000 |
| 2018 | $5,898 | $454,000 | $263,000 | $191,000 |
| 2017 | $4,927 | $364,000 | $202,000 | $162,000 |
| 2016 | $5,295 | $381,000 | $231,000 | $150,000 |
| 2015 | $5,035 | $0 | $0 | $0 |
Source: Public Records
Map
Nearby Homes
- 210 George St
- 161 3rd St
- 163 2nd St
- 101 Center St
- 185 W Lake St
- 6591 Galpin Blvd
- 254 Lake St
- 401 Highway 7
- 205 Mill St Unit S205
- 332 Mill St
- 6040 Oakview Ct
- 6140 Chaska Rd
- 5730 Echo Rd
- 5631 Buffington Ln
- 5635 Buffington Ln
- 5651 Buffington Ln
- 245 Lakeview Ave
- 5655 Buffington Ln
- 5615 Buffington Ln
- 5620 Buffington Ln
Your Personal Tour Guide
Ask me questions while you tour the home.