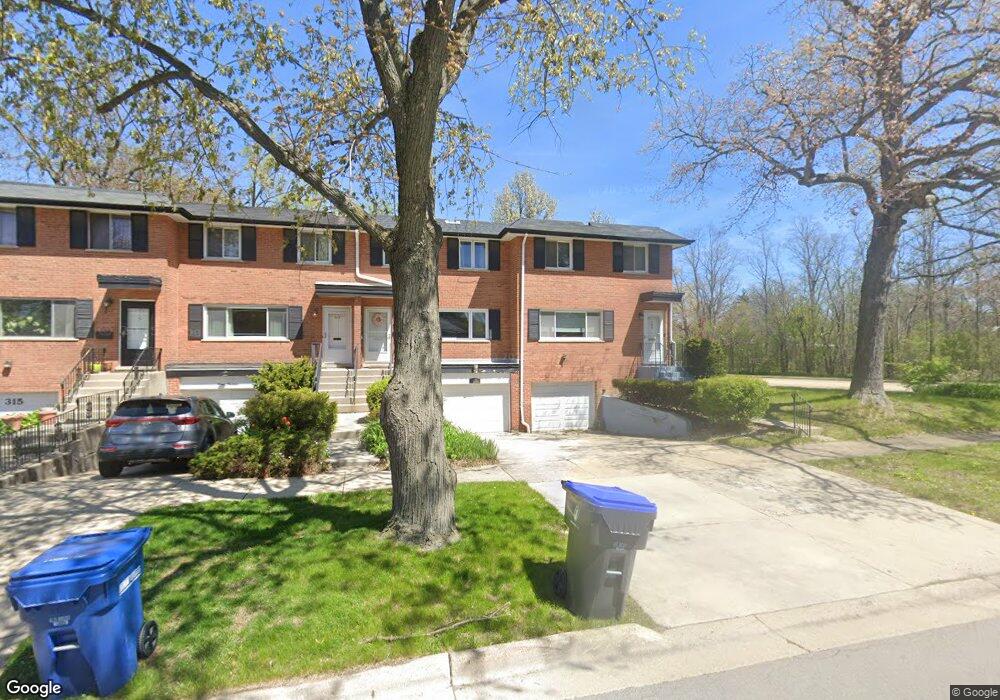
311 Jefferson Ave Glencoe, IL 60022
Estimated Value: $391,000 - $528,000
3
Beds
2
Baths
1,357
Sq Ft
$324/Sq Ft
Est. Value
About This Home
This home is located at 311 Jefferson Ave, Glencoe, IL 60022 and is currently estimated at $439,596, approximately $323 per square foot. 311 Jefferson Ave is a home located in Cook County with nearby schools including South Elementary School, Central School, and West School.
Ownership History
Date
Name
Owned For
Owner Type
Purchase Details
Closed on
Mar 12, 2010
Sold by
Mackiewicz Stephanie
Bought by
Hoefling Nicole A
Current Estimated Value
Home Financials for this Owner
Home Financials are based on the most recent Mortgage that was taken out on this home.
Original Mortgage
$208,000
Outstanding Balance
$136,087
Interest Rate
4.96%
Mortgage Type
New Conventional
Estimated Equity
$303,509
Purchase Details
Closed on
Jan 24, 2005
Sold by
Tung Reynold and Tung Mabel
Bought by
Mackiewicz Stephanie
Home Financials for this Owner
Home Financials are based on the most recent Mortgage that was taken out on this home.
Original Mortgage
$227,700
Interest Rate
5.87%
Mortgage Type
Unknown
Purchase Details
Closed on
Aug 27, 1996
Sold by
Lauck Helen M
Bought by
Tung Reynold and Tung Mabel
Home Financials for this Owner
Home Financials are based on the most recent Mortgage that was taken out on this home.
Original Mortgage
$113,400
Interest Rate
8.3%
Create a Home Valuation Report for This Property
The Home Valuation Report is an in-depth analysis detailing your home's value as well as a comparison with similar homes in the area
Home Values in the Area
Average Home Value in this Area
Purchase History
| Date | Buyer | Sale Price | Title Company |
|---|---|---|---|
| Hoefling Nicole A | $260,000 | Stewart Title Company | |
| Mackiewicz Stephanie | $253,000 | Multiple | |
| Tung Reynold | $170,000 | -- |
Source: Public Records
Mortgage History
| Date | Status | Borrower | Loan Amount |
|---|---|---|---|
| Open | Hoefling Nicole A | $208,000 | |
| Previous Owner | Mackiewicz Stephanie | $227,700 | |
| Previous Owner | Tung Reynold | $113,400 |
Source: Public Records
Tax History
| Year | Tax Paid | Tax Assessment Tax Assessment Total Assessment is a certain percentage of the fair market value that is determined by local assessors to be the total taxable value of land and additions on the property. | Land | Improvement |
|---|---|---|---|---|
| 2025 | $6,781 | $39,000 | $5,866 | $33,134 |
| 2024 | $6,781 | $31,000 | $6,000 | $25,000 |
| 2023 | $6,307 | $31,000 | $6,000 | $25,000 |
| 2022 | $6,307 | $31,000 | $6,000 | $25,000 |
| 2021 | $8,891 | $34,341 | $3,299 | $31,042 |
| 2020 | $8,695 | $34,341 | $3,299 | $31,042 |
| 2019 | $8,383 | $37,328 | $3,299 | $34,029 |
| 2018 | $6,500 | $29,004 | $2,932 | $26,072 |
| 2017 | $6,330 | $29,004 | $2,932 | $26,072 |
| 2016 | $6,146 | $29,004 | $2,932 | $26,072 |
| 2015 | $5,751 | $24,581 | $2,428 | $22,153 |
| 2014 | $5,623 | $24,581 | $2,428 | $22,153 |
| 2013 | $5,349 | $24,581 | $2,428 | $22,153 |
Source: Public Records
Map
Nearby Homes
- 410 Green Bay Rd
- 255 Harbor St
- 378 South Ave
- 516 Drexel Ave
- 1351 Scott Ave
- 100 Old Green Bay Rd
- 677 Greenleaf Ave
- 1423 Asbury Ave
- 955 Vernon Ave
- 1255 Forest Glen Dr N
- 476 Park Ave
- 488 Park Ave
- 1492 Asbury Ave
- 735 Grove St
- 1333 Tower Rd
- 1070 Fisher Ln
- 985 Pine Tree Ln
- 794 Greenwood Ave
- 875 Gordon Terrace
- 1159 Chatfield Rd
- 313 Jefferson Ave
- 309 Jefferson Ave
- 315 Jefferson Ave
- 317 Jefferson Ave
- 368 Green Bay Rd
- 333 Jefferson Ave
- 320 Jefferson Ave
- 322 Jefferson Ave
- 328 Jefferson Ave
- 340 Lake St
- 335 Jefferson Ave
- 334 Jefferson Ave
- 340 Jefferson Ave
- 342 Jefferson Ave
- 337 Madison Ave
- 341 Madison Ave
- 345 Jefferson Ave
- 345 Madison Ave
- 326 Lake St
- 346 Jefferson Ave
Your Personal Tour Guide
Ask me questions while you tour the home.