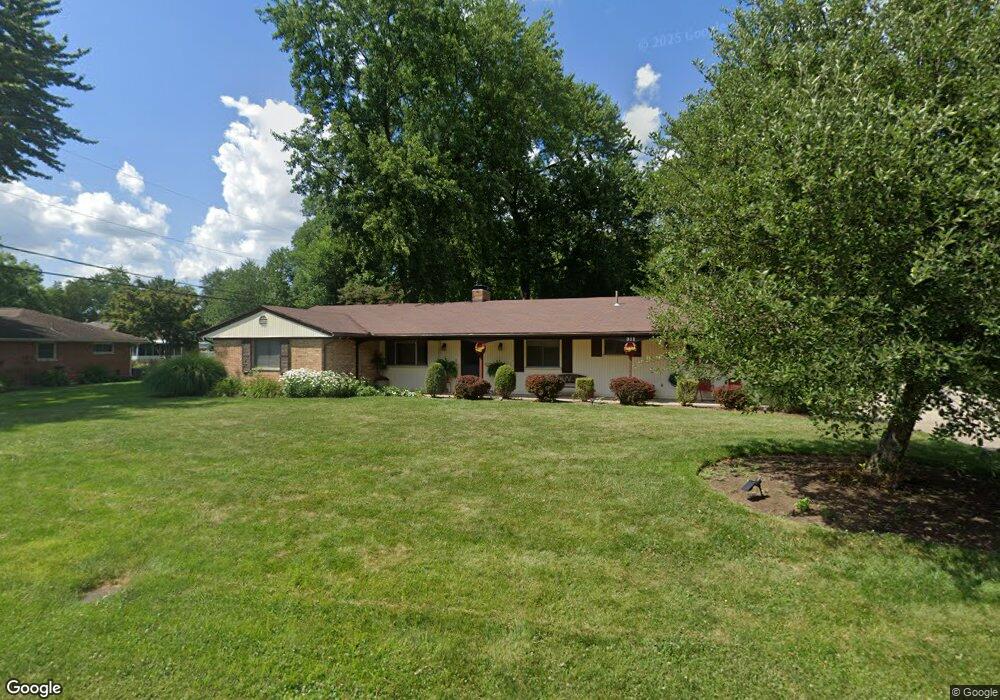
311 Judith Dr Dayton, OH 45429
Estimated Value: $265,000 - $311,000
2
Beds
2
Baths
1,380
Sq Ft
$202/Sq Ft
Est. Value
About This Home
This home is located at 311 Judith Dr, Dayton, OH 45429 and is currently estimated at $278,543, approximately $201 per square foot. 311 Judith Dr is a home located in Montgomery County with nearby schools including Oakview Elementary School, Van Buren Middle School, and Kettering Fairmont High School.
Ownership History
Date
Name
Owned For
Owner Type
Purchase Details
Closed on
Sep 24, 2013
Sold by
Tulloch Sarah A and Tulloch Steven N
Bought by
Tulloch Sarah A and Tulloch Steven N
Current Estimated Value
Home Financials for this Owner
Home Financials are based on the most recent Mortgage that was taken out on this home.
Original Mortgage
$119,750
Outstanding Balance
$89,983
Interest Rate
4.5%
Mortgage Type
Future Advance Clause Open End Mortgage
Estimated Equity
$188,560
Purchase Details
Closed on
Aug 16, 2004
Sold by
Bales Donna B
Bought by
Dooley Sarah Harmon
Home Financials for this Owner
Home Financials are based on the most recent Mortgage that was taken out on this home.
Original Mortgage
$100,000
Interest Rate
6.5%
Mortgage Type
Fannie Mae Freddie Mac
Purchase Details
Closed on
Jan 25, 1996
Sold by
Morgan Wanda F
Bought by
Morgan George A
Create a Home Valuation Report for This Property
The Home Valuation Report is an in-depth analysis detailing your home's value as well as a comparison with similar homes in the area
Home Values in the Area
Average Home Value in this Area
Purchase History
| Date | Buyer | Sale Price | Title Company |
|---|---|---|---|
| Tulloch Sarah A | -- | First American Title Insuran | |
| Dooley Sarah Harmon | $125,000 | -- | |
| Morgan George A | -- | -- |
Source: Public Records
Mortgage History
| Date | Status | Borrower | Loan Amount |
|---|---|---|---|
| Open | Tulloch Sarah A | $119,750 | |
| Closed | Dooley Sarah Harmon | $100,000 | |
| Closed | Dooley Sarah Harmon | $25,000 |
Source: Public Records
Tax History Compared to Growth
Tax History
| Year | Tax Paid | Tax Assessment Tax Assessment Total Assessment is a certain percentage of the fair market value that is determined by local assessors to be the total taxable value of land and additions on the property. | Land | Improvement |
|---|---|---|---|---|
| 2024 | $4,336 | $69,930 | $17,880 | $52,050 |
| 2023 | $4,336 | $69,930 | $17,880 | $52,050 |
| 2022 | $4,238 | $54,060 | $13,860 | $40,200 |
| 2021 | $3,919 | $54,060 | $13,860 | $40,200 |
| 2020 | $3,933 | $54,060 | $13,860 | $40,200 |
| 2019 | $3,494 | $42,460 | $12,600 | $29,860 |
| 2018 | $3,513 | $42,460 | $12,600 | $29,860 |
| 2017 | $3,235 | $42,460 | $12,600 | $29,860 |
| 2016 | $3,037 | $37,430 | $12,600 | $24,830 |
| 2015 | $2,901 | $37,430 | $12,600 | $24,830 |
| 2014 | $2,901 | $37,430 | $12,600 | $24,830 |
| 2012 | -- | $45,750 | $15,740 | $30,010 |
Source: Public Records
Map
Nearby Homes
- 101 Enid Ave
- 4816 Judith Dr
- 4824 Far Hills Ave
- 4808 Judith Dr
- 501 Judith Dr
- 5016 Far Hills Ave
- 617 Laurelann Dr
- 215 Colonial Ln
- 5328 Landau Dr Unit 49
- 5328 Landau Dr
- 4817 Ackerman Blvd
- 5017 Ackerman Blvd
- 5380 Landau Dr Unit 40
- 5416 Landau Dr Unit 7
- 5416 Landau Dr Unit 5
- 321 Princewood Ave
- 804 Lovetta Dr
- 4259 Maxlin Rd
- 791 Willowdale Ave
- 1049 Georgian Dr
- 401 Judith Dr
- 301 Judith Dr
- 400 Pamela Sue Dr
- 4840 Judith Dr
- 320 Judith Dr
- 310 Judith Dr
- 400 Judith Dr
- 410 Pamela Sue Dr
- 4832 Judith Dr
- 410 Judith Dr
- 421 Judith Dr
- 300 Judith Dr
- 4824 Judith Dr
- 420 Pamela Sue Dr
- 4841 Judith Dr
- 4849 Judith Dr
- 4817 Pamela Sue Dr
- 4820 Pamela Sue Dr
- 420 Judith Dr
- 201 Enid Ave