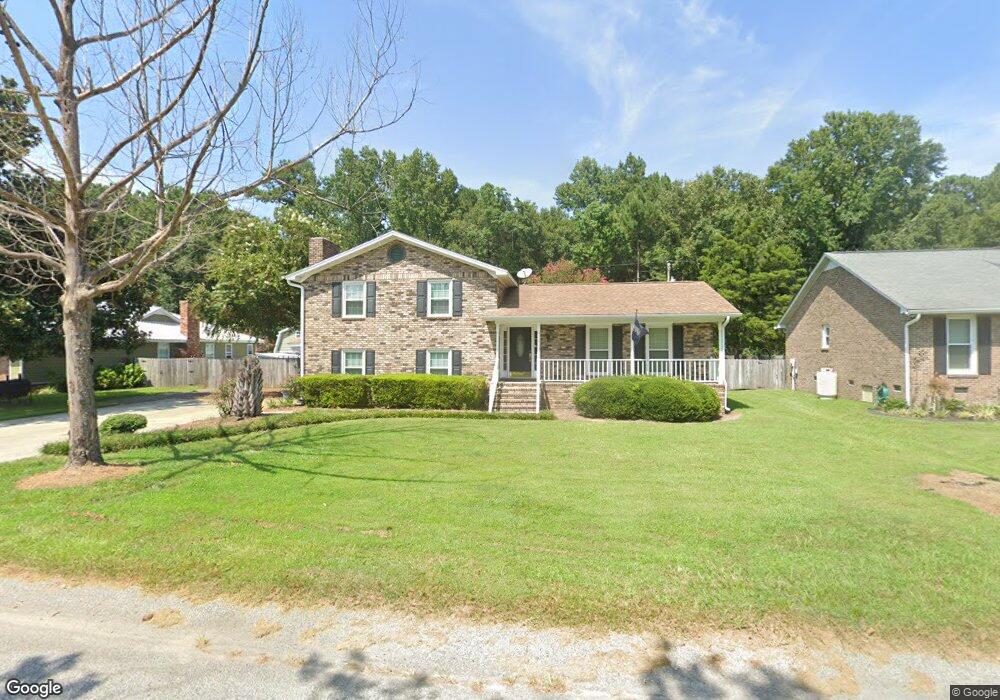
311 Land O Pines Cir Moncks Corner, SC 29461
Estimated Value: $389,000 - $417,000
3
Beds
3
Baths
2,187
Sq Ft
$185/Sq Ft
Est. Value
About This Home
This home is located at 311 Land O Pines Cir, Moncks Corner, SC 29461 and is currently estimated at $405,213, approximately $185 per square foot. 311 Land O Pines Cir is a home located in Berkeley County with nearby schools including Berkeley Elementary School, Berkeley Middle School, and Berkeley High School.
Ownership History
Date
Name
Owned For
Owner Type
Purchase Details
Closed on
Sep 21, 2010
Sold by
Chaplin Tyler
Bought by
Chaplin Clifton Tyler and Chaplin Tyler
Current Estimated Value
Home Financials for this Owner
Home Financials are based on the most recent Mortgage that was taken out on this home.
Original Mortgage
$150,000
Interest Rate
4.52%
Mortgage Type
Future Advance Clause Open End Mortgage
Purchase Details
Closed on
Sep 15, 2010
Sold by
Federal National Mortgage Association
Bought by
Chaplin Tyler
Home Financials for this Owner
Home Financials are based on the most recent Mortgage that was taken out on this home.
Original Mortgage
$150,000
Interest Rate
4.52%
Mortgage Type
Future Advance Clause Open End Mortgage
Purchase Details
Closed on
Jun 10, 2010
Sold by
Colley Michael G
Bought by
Federal National Mortgage Association
Purchase Details
Closed on
Feb 3, 2009
Sold by
Colley Rhonda
Bought by
Colley Michael G
Purchase Details
Closed on
May 14, 1999
Sold by
Moss Kenneth R
Bought by
Colley Michael G
Create a Home Valuation Report for This Property
The Home Valuation Report is an in-depth analysis detailing your home's value as well as a comparison with similar homes in the area
Home Values in the Area
Average Home Value in this Area
Purchase History
| Date | Buyer | Sale Price | Title Company |
|---|---|---|---|
| Chaplin Clifton Tyler | -- | -- | |
| Chaplin Tyler | $149,900 | -- | |
| Federal National Mortgage Association | $2,500 | -- | |
| Colley Michael G | -- | -- | |
| Colley Michael G | $116,000 | -- |
Source: Public Records
Mortgage History
| Date | Status | Borrower | Loan Amount |
|---|---|---|---|
| Closed | Chaplin Clifton Tyler | $150,000 | |
| Closed | Chaplin Tyler | $150,000 |
Source: Public Records
Tax History Compared to Growth
Tax History
| Year | Tax Paid | Tax Assessment Tax Assessment Total Assessment is a certain percentage of the fair market value that is determined by local assessors to be the total taxable value of land and additions on the property. | Land | Improvement |
|---|---|---|---|---|
| 2025 | $1,095 | $226,941 | $43,055 | $183,886 |
| 2024 | $1,048 | $9,077 | $1,722 | $7,355 |
| 2023 | $1,048 | $9,077 | $1,722 | $7,355 |
| 2022 | $1,048 | $7,893 | $1,815 | $6,078 |
| 2021 | $1,073 | $7,900 | $1,815 | $6,078 |
| 2020 | $1,086 | $7,893 | $1,815 | $6,078 |
| 2019 | $1,079 | $7,893 | $1,815 | $6,078 |
| 2018 | $1,004 | $6,864 | $1,800 | $5,064 |
| 2017 | $905 | $6,864 | $1,800 | $5,064 |
| 2016 | $926 | $6,860 | $1,800 | $5,060 |
| 2015 | $856 | $6,860 | $1,800 | $5,060 |
| 2014 | $843 | $6,860 | $1,800 | $5,060 |
| 2013 | -- | $6,860 | $1,800 | $5,060 |
Source: Public Records
Map
Nearby Homes
- 310 Land O Pines Cir
- 130 Land O Pines Cir
- 1636 Pinopolis Rd
- 1748 Pinopolis Rd
- 1554 Pinopolis Rd
- 927 Fishburne Rd
- 601 Levee Dr
- 233 Harlock Dr
- 1051 Cooper Store Rd
- 112 Landerhill Ln
- 120 Nazareth Ln
- 00 Haynesville Rd Extension
- 136 West St
- 283 W End Dr
- 122 Pinewood Dr
- 343 W End Dr
- ROBIE Plan at Lakeview at Kitfield
- GALEN Plan at Lakeview at Kitfield
- DARBY-EXP Plan at Lakeview at Kitfield
- ELSTON Plan at Lakeview at Kitfield
- 309 Land O Pines Cir
- 313 Land O Pines Cir
- 307 Land O Pines Cir
- 315 Land O Pines Cir
- 308 Land O Pines Cir
- 314 Land O Pines Cir
- 302 Patrick Ct
- 317 Land O Pines Cir
- 303 Whitewood Ct
- 318 Land O Pines Cir
- 303 Land O Pines Cir
- 304 Patrick Ct
- 304 Land O Pines Cir
- 319 Land O Pines Cir
- 302 Whitewood Ct
- 305 Patrick Ct
- 302 Meadowlark Ln
- 306 Patrick Ave
- 306 Patrick Ct
- 306 Patrick Ct