Estimated Value: $911,192 - $2,236,000
2
Beds
2
Baths
1,440
Sq Ft
$951/Sq Ft
Est. Value
About This Home
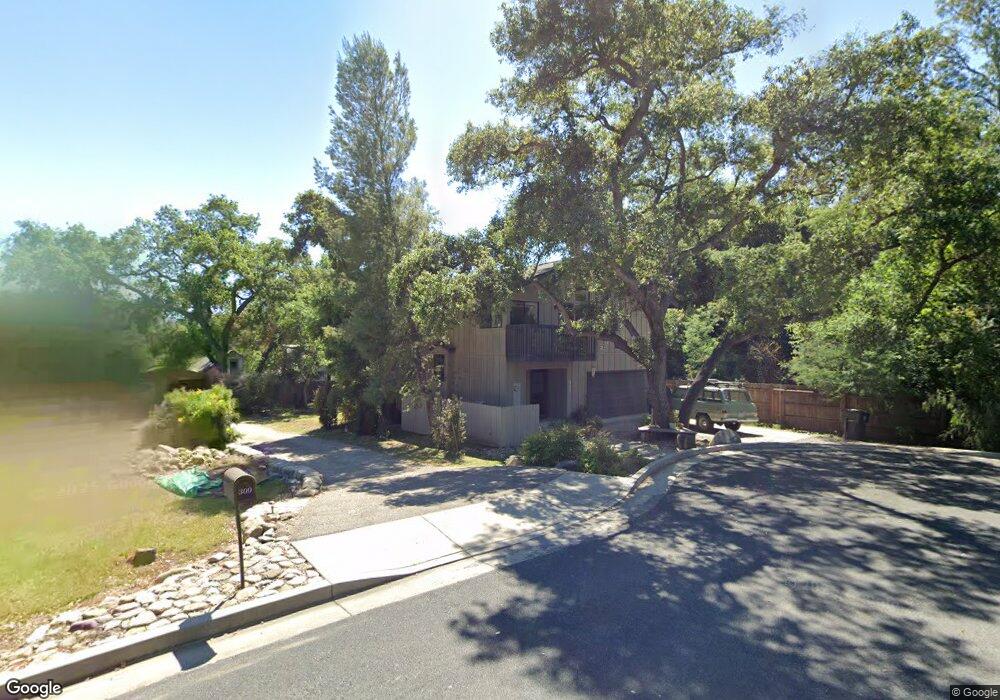
This home is located at 311 Mckee St, Ojai, CA 93023 and is currently estimated at $1,370,048, approximately $951 per square foot. 311 Mckee St is a home located in Ventura County with nearby schools including Topa Topa Elementary School, Meiners Oaks Elementary School, and Matilija Junior High.
Ownership History
Date
Name
Owned For
Owner Type
Purchase Details
Closed on
Dec 20, 2006
Sold by
Hilgers Christopher J and Hilgers Wendy Granholm
Bought by
Hilgers Christopher J and Hilgers Wendy G
Current Estimated Value
Purchase Details
Closed on
Oct 6, 1997
Sold by
Hilgers Christopher J and Hilgers Wendy Granholm
Bought by
Hilgers Christopher J and Hilgers Wendy Granholm
Home Financials for this Owner
Home Financials are based on the most recent Mortgage that was taken out on this home.
Original Mortgage
$140,000
Interest Rate
7.49%
Create a Home Valuation Report for This Property
The Home Valuation Report is an in-depth analysis detailing your home's value as well as a comparison with similar homes in the area
Home Values in the Area
Average Home Value in this Area
Purchase History
| Date | Buyer | Sale Price | Title Company |
|---|---|---|---|
| Hilgers Christopher J | -- | None Available | |
| Hilgers Christopher J | -- | Old Republic Title Company |
Source: Public Records
Mortgage History
| Date | Status | Borrower | Loan Amount |
|---|---|---|---|
| Closed | Hilgers Christopher J | $140,000 |
Source: Public Records
Tax History
| Year | Tax Paid | Tax Assessment Tax Assessment Total Assessment is a certain percentage of the fair market value that is determined by local assessors to be the total taxable value of land and additions on the property. | Land | Improvement |
|---|---|---|---|---|
| 2025 | $3,600 | $211,923 | $17,652 | $194,271 |
| 2024 | $3,600 | $207,768 | $17,306 | $190,462 |
| 2023 | $3,483 | $203,695 | $16,967 | $186,728 |
| 2022 | $3,457 | $199,701 | $16,634 | $183,067 |
| 2021 | $3,428 | $195,786 | $16,308 | $179,478 |
| 2020 | $3,350 | $193,781 | $16,142 | $177,639 |
| 2019 | $3,263 | $189,982 | $15,826 | $174,156 |
| 2018 | $3,224 | $186,258 | $15,516 | $170,742 |
| 2017 | $3,175 | $182,607 | $15,212 | $167,395 |
| 2016 | $2,760 | $179,027 | $14,914 | $164,113 |
| 2015 | $2,733 | $176,340 | $14,691 | $161,649 |
| 2014 | $2,544 | $172,888 | $14,404 | $158,484 |
Source: Public Records
Map
Nearby Homes
- 810 Libby Ave
- 515 Del Oro Dr
- 408 Canada St
- 520 Foothill Rd
- 0 N Ventura Unit TR25015633
- 212 Foothill Rd
- 207 E Eucalyptus St
- 203 Foothill Rd
- 216 E Aliso St
- 207 S Blanche St
- 300 W Santa Ana St
- 203 S Montgomery St
- 201 Drown Ave
- 275 Fairview Rd
- 608 E Ojai Ave
- 211 Fox St
- 310 N Fulton St
- 312 Fox St
- 901 Grandview Ave
- 917 Grandview Ave
Your Personal Tour Guide
Ask me questions while you tour the home.