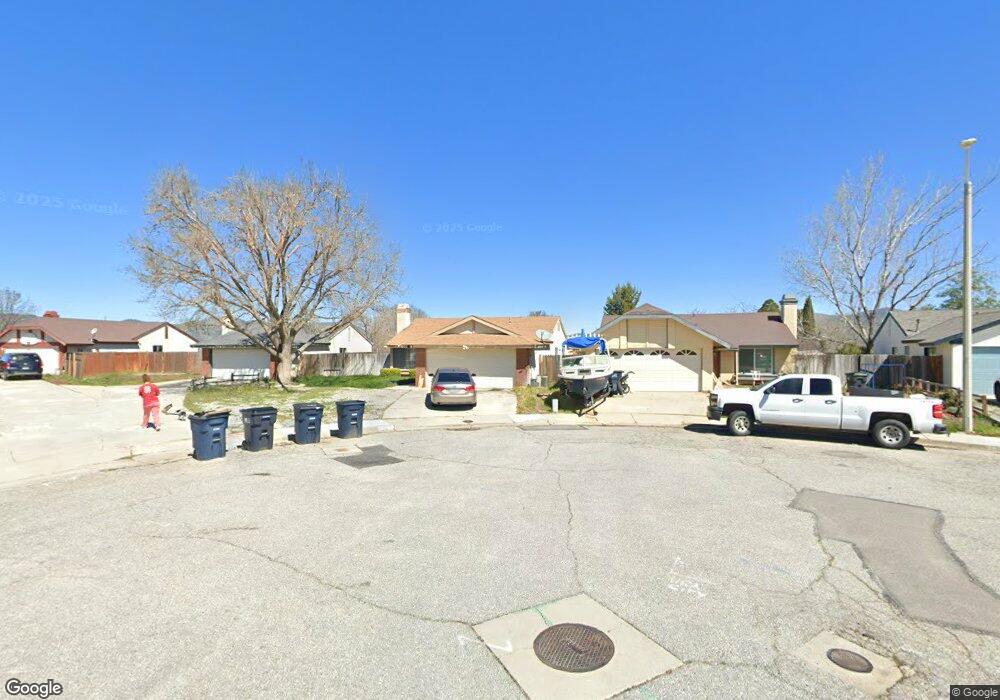
311 Meadowbrook Ct Tehachapi, CA 93561
Estimated Value: $238,000 - $328,000
3
Beds
2
Baths
1,032
Sq Ft
$290/Sq Ft
Est. Value
About This Home
This home is located at 311 Meadowbrook Ct, Tehachapi, CA 93561 and is currently estimated at $298,955, approximately $289 per square foot. 311 Meadowbrook Ct is a home located in Kern County with nearby schools including Tompkins Elementary School, Jacobsen Middle School, and Tehachapi High School.
Ownership History
Date
Name
Owned For
Owner Type
Purchase Details
Closed on
May 28, 2014
Sold by
Herrick Megan E
Bought by
Herrick Samuel F
Current Estimated Value
Purchase Details
Closed on
May 22, 2014
Sold by
Anderson Melinda
Bought by
Anderson Melinda and Herrick Samuel F
Purchase Details
Closed on
Feb 19, 2003
Sold by
Morton Elma Fay and The Elma Fay Morton Trust
Bought by
Anderson Melinda
Purchase Details
Closed on
Mar 14, 2002
Sold by
Morton Elma Fay
Bought by
Morton Elma Fay and Elma Fay Morton Trust
Purchase Details
Closed on
Mar 16, 1995
Sold by
Va
Bought by
Morton Robert C and Morton Elma Fay
Home Financials for this Owner
Home Financials are based on the most recent Mortgage that was taken out on this home.
Original Mortgage
$42,990
Interest Rate
8.9%
Mortgage Type
Seller Take Back
Purchase Details
Closed on
Jul 28, 1994
Sold by
Countrywide Title Corp
Bought by
Countrywide Funding Corp
Create a Home Valuation Report for This Property
The Home Valuation Report is an in-depth analysis detailing your home's value as well as a comparison with similar homes in the area
Home Values in the Area
Average Home Value in this Area
Purchase History
| Date | Buyer | Sale Price | Title Company |
|---|---|---|---|
| Herrick Samuel F | -- | Accommodation | |
| Anderson Melinda | -- | Accommodation | |
| Anderson Melinda | $77,000 | Chicago Title | |
| Morton Elma Fay | -- | -- | |
| Morton Robert C | $48,000 | First American Title Ins Co | |
| Countrywide Funding Corp | $63,943 | World Title Company | |
| Va | -- | World Title Company |
Source: Public Records
Mortgage History
| Date | Status | Borrower | Loan Amount |
|---|---|---|---|
| Previous Owner | Morton Robert C | $42,990 |
Source: Public Records
Tax History
| Year | Tax Paid | Tax Assessment Tax Assessment Total Assessment is a certain percentage of the fair market value that is determined by local assessors to be the total taxable value of land and additions on the property. | Land | Improvement |
|---|---|---|---|---|
| 2025 | $1,450 | $111,499 | $26,059 | $85,440 |
| 2024 | $1,396 | $109,314 | $25,549 | $83,765 |
| 2023 | $1,396 | $107,172 | $25,049 | $82,123 |
| 2022 | $1,377 | $105,071 | $24,558 | $80,513 |
| 2021 | $1,331 | $103,012 | $24,077 | $78,935 |
| 2020 | $1,322 | $101,957 | $23,831 | $78,126 |
| 2019 | $1,322 | $101,957 | $23,831 | $78,126 |
| 2018 | $1,277 | $98,000 | $22,906 | $75,094 |
| 2017 | $1,276 | $96,079 | $22,457 | $73,622 |
| 2016 | $1,243 | $94,196 | $22,017 | $72,179 |
| 2015 | $1,185 | $92,782 | $21,687 | $71,095 |
| 2014 | $1,173 | $90,966 | $21,263 | $69,703 |
Source: Public Records
Map
Nearby Homes
- 1309 Clasico Dr
- 212 Artina Ct
- 219 Artina Ct
- 210 Pinon St Unit 11
- 210 Pinon St Unit 18
- 210 Pinon St Unit 4
- 210 Pinon St Unit 1
- 210 Pinon St Unit 6
- 210 Pinon St Unit 15
- 210 Pinon St Unit 5
- 210 Pinon St Unit 9
- 210 Pinon St Unit 7
- 210 Pinon St Unit 13
- 210 Pinon St Unit 8
- 210 Pinon St Unit 3
- 210 Pinon St Unit 16
- 210 Pinon St Unit 19
- 210 Pinon St Unit 10
- 210 Pinon St Unit 12
- 210 Pinon St Unit 14
- 313 Meadowbrook Ct
- 309 Meadowbrook Ct
- 1209 Alder Ave
- 307 Meadowbrook Ct
- 315 Meadowbrook Ct
- 316 Meadowbrook Ct
- 1217 Alder Ave
- 1205 Alder Ave
- 314 Meadowbrook Ct
- 1221 Alder Ave
- 305 Meadowbrook Ct
- 305 Meadowbrook Ct
- 303 Meadowbrook Ct
- 1201 Alder Ave
- 312 Meadowbrook Ct
- 1225 Alder Ave
- 310 Meadowbrook Ct
- 1167 Alder Ave
- 1305 Clasico Dr
- 1229 Alder Ave
Your Personal Tour Guide
Ask me questions while you tour the home.