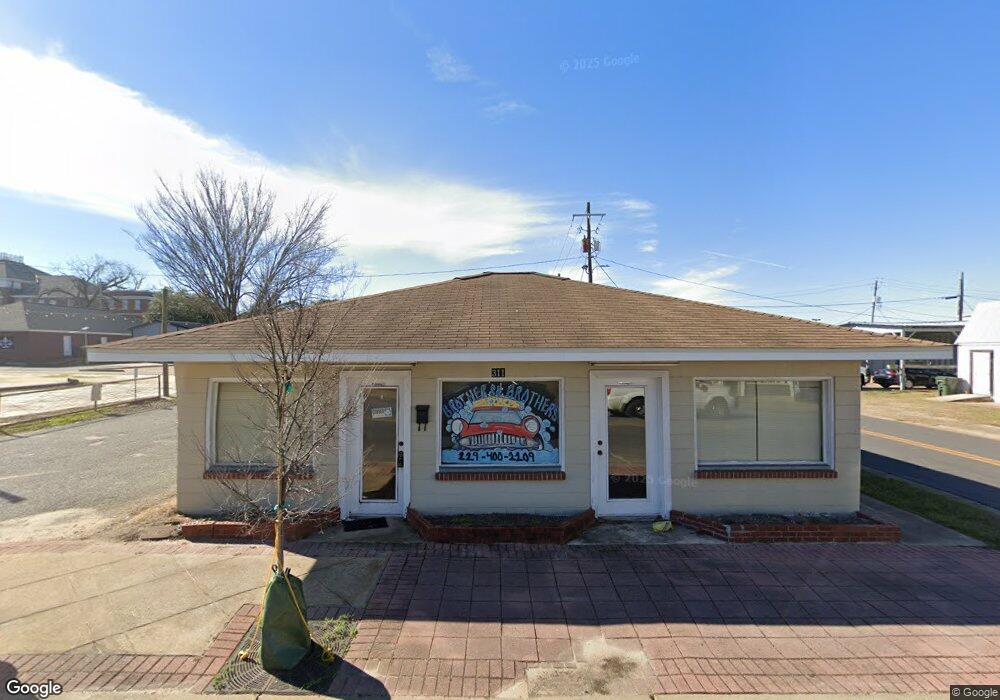
311 N Broad St Bainbridge, GA 39817
Estimated Value: $132,694
Studio
2
Baths
916
Sq Ft
$145/Sq Ft
Est. Value
About This Home
This home is located at 311 N Broad St, Bainbridge, GA 39817 and is currently estimated at $132,694, approximately $144 per square foot. 311 N Broad St is a home located in Decatur County with nearby schools including Bainbridge High School and Grace Christian Academy.
Ownership History
Date
Name
Owned For
Owner Type
Purchase Details
Closed on
Feb 10, 2025
Sold by
Clements Perry
Bought by
Ja Holdings Llc
Current Estimated Value
Purchase Details
Closed on
Jul 3, 2018
Sold by
Bull Farms Llc
Bought by
Clements Perry L
Purchase Details
Closed on
Jul 7, 2015
Sold by
Cadred Llc
Bought by
Bull Farms Llc
Purchase Details
Closed on
Apr 16, 2015
Sold by
Wells Tripolie Scott
Bought by
Cadrid Llc
Purchase Details
Closed on
Jan 7, 2013
Sold by
Cadred Llc
Bought by
Wells Tripolie Scott
Purchase Details
Closed on
Dec 29, 2009
Sold by
Mills Thomas D
Bought by
Cadred Llc
Purchase Details
Closed on
Jan 5, 2007
Sold by
Barber John B
Bought by
Mills Thomas D and Fagan John Bryant
Home Financials for this Owner
Home Financials are based on the most recent Mortgage that was taken out on this home.
Original Mortgage
$45,000
Interest Rate
6.05%
Mortgage Type
Commercial
Purchase Details
Closed on
Jan 17, 2006
Sold by
Powell Denwell Wayne
Bought by
Barber John B and Barber Elise D
Create a Home Valuation Report for This Property
The Home Valuation Report is an in-depth analysis detailing your home's value as well as a comparison with similar homes in the area
Purchase History
| Date | Buyer | Sale Price | Title Company |
|---|---|---|---|
| Ja Holdings Llc | $135,000 | -- | |
| Clements Perry L | $50,000 | -- | |
| Bull Farms Llc | $44,000 | -- | |
| Cadrid Llc | -- | -- | |
| Wells Tripolie Scott | $58,000 | -- | |
| Cadred Llc | $52,250 | -- | |
| Mills Thomas D | $37,000 | -- | |
| Barber John B | $32,000 | -- |
Source: Public Records
Mortgage History
| Date | Status | Borrower | Loan Amount |
|---|---|---|---|
| Previous Owner | Mills Thomas D | $45,000 | |
| Closed | Barber John B | $0 |
Source: Public Records
Tax History
| Year | Tax Paid | Tax Assessment Tax Assessment Total Assessment is a certain percentage of the fair market value that is determined by local assessors to be the total taxable value of land and additions on the property. | Land | Improvement |
|---|---|---|---|---|
| 2025 | $682 | $21,170 | $4,550 | $16,620 |
| 2024 | $662 | $20,953 | $4,333 | $16,620 |
| 2023 | $488 | $15,486 | $4,333 | $11,153 |
| 2022 | $596 | $19,318 | $4,333 | $14,985 |
| 2021 | $612 | $19,318 | $4,333 | $14,985 |
| 2020 | $646 | $19,318 | $4,333 | $14,985 |
| 2019 | $671 | $19,318 | $4,333 | $14,985 |
| 2018 | $664 | $19,318 | $4,333 | $14,985 |
| 2017 | $672 | $19,229 | $4,244 | $14,985 |
| 2016 | $615 | $18,306 | $4,244 | $14,061 |
| 2015 | $736 | $17,600 | $3,648 | $13,952 |
| 2014 | $682 | $20,478 | $4,244 | $16,234 |
| 2013 | -- | $21,154 | $4,244 | $16,910 |
Source: Public Records
Map
Nearby Homes
- 502 Planter St
- 418 E Broughton St
- 249 Meredith Dr
- Lot 3 Mountain View Way
- 0000 Mountain View Way
- Lot 4C Knollwood
- Lot 8 Mountain View Way
- 306 S Broad St
- 627 Planter St
- Dell Rd
- 410 S Broad St
- 414 S Broad St
- 210 W Evans St
- 409 E Evans St
- 640 E Shotwell St
- 415 Charles St
- 719 W Shotwell St
- 632 E Evans St
- 936 Cooper St
- 719 Hall St
- 308 N West St
- 308 N West St
- 402 N West St
- 222 Planter St
- 301 N Clark St
- 212 N Broad St
- 131 E Water St
- 200 N Broad St
- 129 E Water St Unit 2ND FLOOR UNIT 3
- 211 E Water St
- 213 E Water St
- 300 N Clark St
- 215 E Water St
- 201 N Broad St
- 225 E Water St
- 317 N Clay St
- 126 N Broad St
- 101 W Water St
- 214 E Water St
- 121 N West St
Your Personal Tour Guide
Ask me questions while you tour the home.