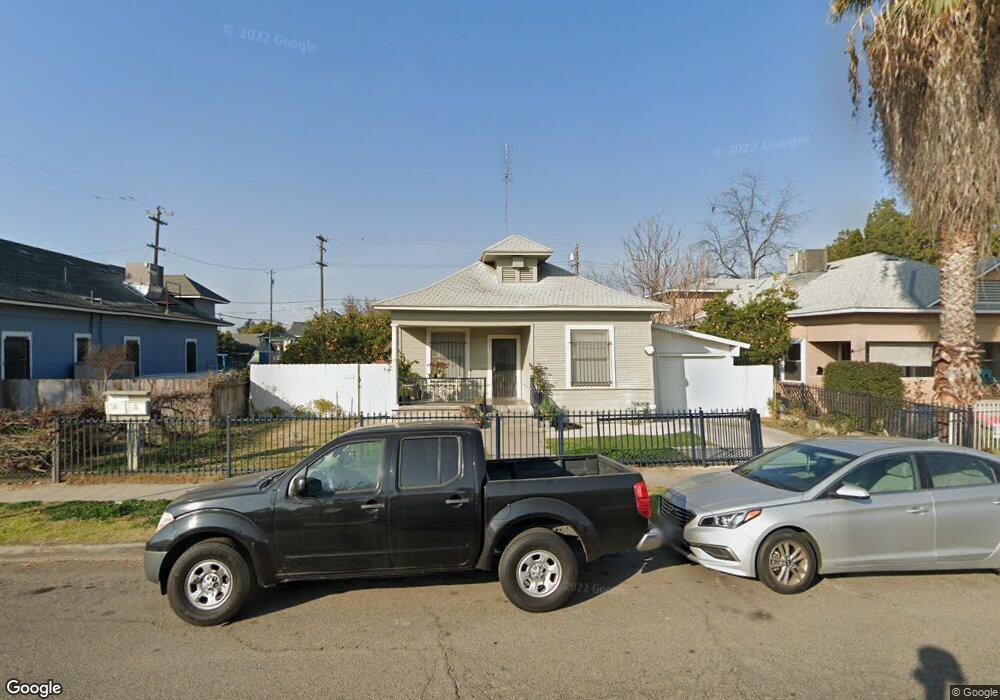
311 N Thesta St Fresno, CA 93701
Jefferson NeighborhoodEstimated Value: $275,000 - $350,000
3
Beds
1
Bath
1,838
Sq Ft
$167/Sq Ft
Est. Value
About This Home
This home is located at 311 N Thesta St, Fresno, CA 93701 and is currently estimated at $307,614, approximately $167 per square foot. 311 N Thesta St is a home located in Fresno County with nearby schools including Akira Yokomi Elementary School, Tehipite Middle School, and Roosevelt High School.
Ownership History
Date
Name
Owned For
Owner Type
Purchase Details
Closed on
Oct 27, 2016
Sold by
Mendoza Juventino M and Mendoza Alma
Bought by
C & I Saiz Partnership
Current Estimated Value
Purchase Details
Closed on
Sep 28, 2005
Sold by
Green Daniel
Bought by
Green Sharon L
Home Financials for this Owner
Home Financials are based on the most recent Mortgage that was taken out on this home.
Original Mortgage
$185,000
Interest Rate
5.68%
Mortgage Type
Fannie Mae Freddie Mac
Purchase Details
Closed on
Sep 27, 2005
Sold by
Green Sharon L
Bought by
Mendoza Juventino M and Mendoza Alma
Home Financials for this Owner
Home Financials are based on the most recent Mortgage that was taken out on this home.
Original Mortgage
$185,000
Interest Rate
5.68%
Mortgage Type
Fannie Mae Freddie Mac
Purchase Details
Closed on
Jan 24, 1997
Sold by
Bolina Mcpherson Susan
Bought by
Green Sharon L and Green Teresa L
Create a Home Valuation Report for This Property
The Home Valuation Report is an in-depth analysis detailing your home's value as well as a comparison with similar homes in the area
Home Values in the Area
Average Home Value in this Area
Purchase History
| Date | Buyer | Sale Price | Title Company |
|---|---|---|---|
| C & I Saiz Partnership | $90,000 | Old Republic Title Company | |
| Green Sharon L | -- | Fidelity National Title Co | |
| Heck Jenifer Green | -- | Fidelity National Title Co | |
| Mendoza Juventino M | $259,000 | Fidelity National Title Co | |
| Green Sharon L | -- | Fidelity National Title Co | |
| Green Sharon L | $30,000 | -- |
Source: Public Records
Mortgage History
| Date | Status | Borrower | Loan Amount |
|---|---|---|---|
| Previous Owner | Mendoza Juventino M | $185,000 |
Source: Public Records
Tax History Compared to Growth
Tax History
| Year | Tax Paid | Tax Assessment Tax Assessment Total Assessment is a certain percentage of the fair market value that is determined by local assessors to be the total taxable value of land and additions on the property. | Land | Improvement |
|---|---|---|---|---|
| 2025 | $1,334 | $104,447 | $17,406 | $87,041 |
| 2023 | $1,308 | $100,393 | $16,731 | $83,662 |
| 2022 | $1,291 | $98,425 | $16,403 | $82,022 |
| 2021 | $1,256 | $96,496 | $16,082 | $80,414 |
| 2020 | $1,251 | $95,508 | $15,918 | $79,590 |
| 2019 | $1,203 | $93,636 | $15,606 | $78,030 |
| 2018 | $1,178 | $91,800 | $15,300 | $76,500 |
| 2017 | $1,158 | $90,000 | $15,000 | $75,000 |
| 2016 | $874 | $68,224 | $18,477 | $49,747 |
| 2015 | $861 | $67,200 | $18,200 | $49,000 |
| 2014 | $805 | $63,000 | $17,100 | $45,900 |
Source: Public Records
Map
Nearby Homes
- 349 N Fresno St
- 2939 E Grant Ave
- 2521 E Washington Ave
- 320 N Effie St
- 209 N Diana St
- 244 N U St
- 330 N Abby St
- 2726 E Washington Ave
- 2405 E White Ave
- 2025 E White Ave
- 2401 E Thomas Ave
- 360 N Calaveras St Unit A-E
- 704 N Fresno St
- 230 N Calaveras St
- 2203 E Harvey Ave
- 123 No Address
- 824 N Thesta St
- 274 N Glenn Ave
- 3006 E Mckenzie Ave
- 408 N Orchard St
- 315 N Thesta St
- 305 N Thesta St
- 321 N Thesta St
- 2215 E Mckenzie Ave
- 2211 E Mckenzie Ave
- 326 N Valeria St
- 2203 E Mckenzie Ave
- 330 N Valeria St
- 337 N Thesta St Unit 201
- 337 N Thesta St
- 337 N Thesta St Unit 101
- 337 N Thesta St Unit 1-202
- 340 N Valeria St
- 345 N Thesta St
- 347 N Thesta St
- 349 N Thesta St
- 315 N Valeria St
- 309 N Valeria St
- 319 N Valeria St
- 305 N Valeria St