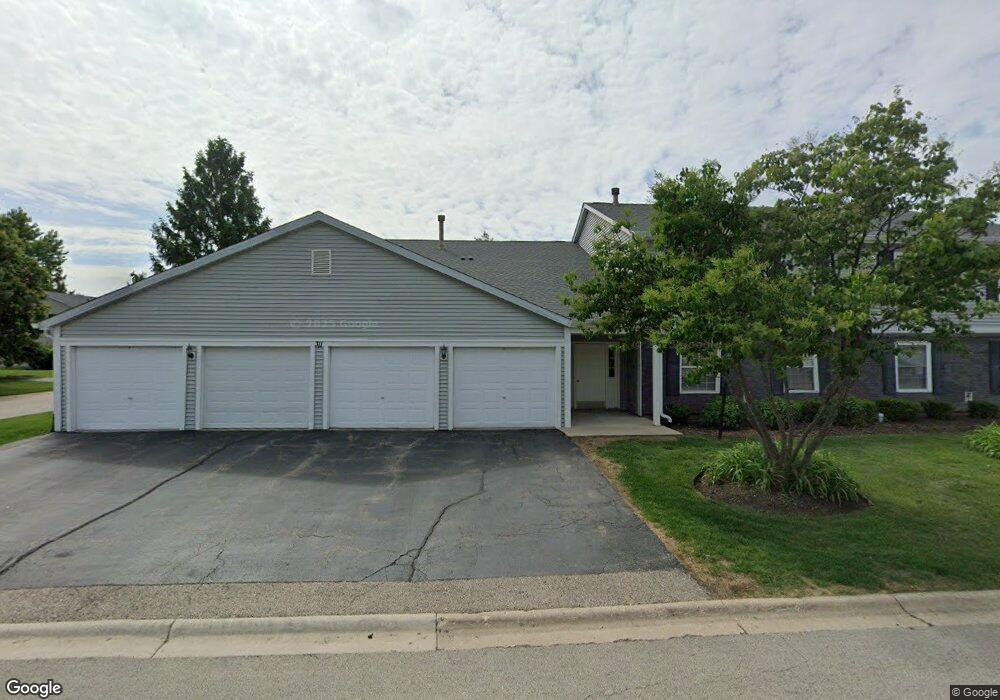
311 Newport Ln Unit A2 Bartlett, IL 60103
Estimated Value: $236,000 - $245,000
2
Beds
2
Baths
1,100
Sq Ft
$217/Sq Ft
Est. Value
About This Home
This home is located at 311 Newport Ln Unit A2, Bartlett, IL 60103 and is currently estimated at $238,529, approximately $216 per square foot. 311 Newport Ln Unit A2 is a home located in Cook County with nearby schools including Bartlett Elementary School, Eastview Middle School, and South Elgin High School.
Ownership History
Date
Name
Owned For
Owner Type
Purchase Details
Closed on
Jun 28, 2007
Sold by
Ulrich Thomas R
Bought by
Rabiola Joanna
Current Estimated Value
Home Financials for this Owner
Home Financials are based on the most recent Mortgage that was taken out on this home.
Original Mortgage
$130,400
Outstanding Balance
$81,066
Interest Rate
6.76%
Mortgage Type
Unknown
Estimated Equity
$157,463
Purchase Details
Closed on
Aug 14, 1998
Sold by
Markunas James A
Bought by
Ulrich Thomas R
Home Financials for this Owner
Home Financials are based on the most recent Mortgage that was taken out on this home.
Original Mortgage
$40,000
Interest Rate
6.99%
Purchase Details
Closed on
Jun 28, 1995
Sold by
Sangorska Albert L and Sangorska Joan M
Bought by
Markunas James A
Home Financials for this Owner
Home Financials are based on the most recent Mortgage that was taken out on this home.
Original Mortgage
$83,500
Interest Rate
7.88%
Create a Home Valuation Report for This Property
The Home Valuation Report is an in-depth analysis detailing your home's value as well as a comparison with similar homes in the area
Home Values in the Area
Average Home Value in this Area
Purchase History
| Date | Buyer | Sale Price | Title Company |
|---|---|---|---|
| Rabiola Joanna | $163,000 | Pntn | |
| Ulrich Thomas R | -- | Professional National Title | |
| Ulrich Thomas R | $93,500 | -- | |
| Markunas James A | $89,500 | -- |
Source: Public Records
Mortgage History
| Date | Status | Borrower | Loan Amount |
|---|---|---|---|
| Open | Rabiola Joanna | $130,400 | |
| Previous Owner | Ulrich Thomas R | $40,000 | |
| Previous Owner | Markunas James A | $83,500 |
Source: Public Records
Tax History
| Year | Tax Paid | Tax Assessment Tax Assessment Total Assessment is a certain percentage of the fair market value that is determined by local assessors to be the total taxable value of land and additions on the property. | Land | Improvement |
|---|---|---|---|---|
| 2025 | $5,056 | $23,479 | $908 | $22,571 |
| 2024 | $5,056 | $15,974 | $648 | $15,326 |
| 2023 | $4,885 | $15,974 | $648 | $15,326 |
| 2022 | $4,885 | $15,974 | $648 | $15,326 |
| 2021 | $4,216 | $11,346 | $551 | $10,795 |
| 2020 | $4,160 | $11,346 | $551 | $10,795 |
| 2019 | $4,181 | $12,750 | $551 | $12,199 |
| 2018 | $3,033 | $8,483 | $486 | $7,997 |
| 2017 | $2,982 | $8,483 | $486 | $7,997 |
| 2016 | $2,784 | $8,483 | $486 | $7,997 |
| 2015 | $2,411 | $6,798 | $421 | $6,377 |
| 2014 | $2,381 | $6,798 | $421 | $6,377 |
| 2013 | $2,289 | $6,798 | $421 | $6,377 |
Source: Public Records
Map
Nearby Homes
- 355 Wilmington Dr Unit C1
- 370 Wilmington Dr Unit D2
- 615 Mallard Ct Unit C2
- 748 Sterling Ct Unit A2
- 745 Candleridge Ct Unit B2
- 195 Mary Ct Unit A
- 194 Robert Ct Unit A
- 119 E Railroad Ave
- 110 N Chase Ave
- 275 E Railroad Ave Unit 101
- 305 E Country Dr
- 27W607 Devon Ave
- 1105 Sandpiper Ct
- 6835 Plumtree Ln
- 6881 Hickory St
- 6967 Hemlock St
- 6988 Plumtree Ln
- 128 Sycamore Ave
- 2110 Cherry Ave
- 403 W Oneida Ave
- 311 Newport Ln Unit B1
- 311 Newport Ln Unit A1
- 311 Newport Ln Unit B2
- 303 Newport Ln Unit C2
- 303 Newport Ln Unit D2
- 303 Newport Ln Unit D1
- 303 Newport Ln Unit C1
- 657 Thorntree Ct Unit C2
- 657 Thorntree Ct Unit C1
- 657 Thorntree Ct Unit D1
- 657 Thorntree Ct Unit D2
- 657 Thorntree Ct Unit 27B22
- 310 Newport Ln Unit C2
- 310 Newport Ln Unit D2
- 310 Newport Ln Unit C1
- 310 Newport Ln Unit 35A12
- 319 Newport Ln Unit C1
- 319 Newport Ln Unit D1
- 319 Newport Ln Unit 23B22
- 319 Newport Ln Unit D2
Your Personal Tour Guide
Ask me questions while you tour the home.