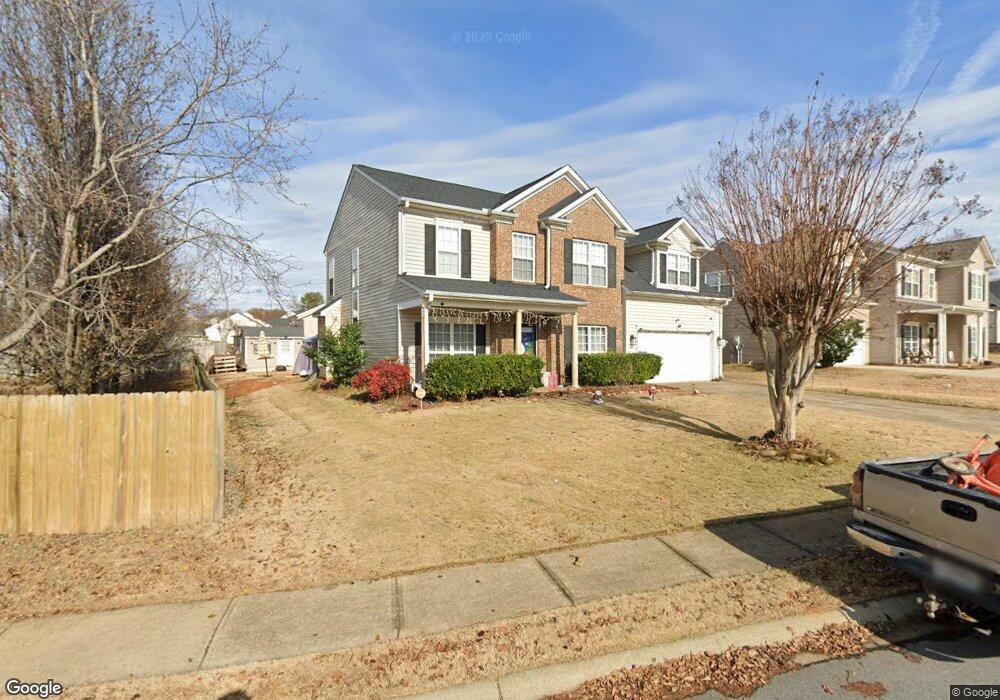
311 Nightshade Ln Duncan, SC 29334
Estimated Value: $339,357 - $396,000
3
Beds
3
Baths
2,537
Sq Ft
$141/Sq Ft
Est. Value
About This Home
This home is located at 311 Nightshade Ln, Duncan, SC 29334 and is currently estimated at $356,839, approximately $140 per square foot. 311 Nightshade Ln is a home located in Spartanburg County with nearby schools including Abner Creek Academy, Byrnes Freshman Academy, and James F. Byrnes High School.
Ownership History
Date
Name
Owned For
Owner Type
Purchase Details
Closed on
Feb 27, 2008
Sold by
Redding Gregory L
Bought by
Redding Lisa M
Current Estimated Value
Home Financials for this Owner
Home Financials are based on the most recent Mortgage that was taken out on this home.
Original Mortgage
$192,850
Outstanding Balance
$119,011
Interest Rate
5.65%
Mortgage Type
FHA
Estimated Equity
$237,828
Purchase Details
Closed on
Feb 15, 2008
Sold by
Redding Lisa M
Bought by
Redding Gregory L
Home Financials for this Owner
Home Financials are based on the most recent Mortgage that was taken out on this home.
Original Mortgage
$192,850
Outstanding Balance
$119,011
Interest Rate
5.65%
Mortgage Type
FHA
Estimated Equity
$237,828
Purchase Details
Closed on
Aug 22, 2006
Sold by
Kelly David and Kelly Janice
Bought by
Redding Gregory L and Redding Lisa M
Home Financials for this Owner
Home Financials are based on the most recent Mortgage that was taken out on this home.
Original Mortgage
$148,800
Interest Rate
6.67%
Mortgage Type
New Conventional
Purchase Details
Closed on
Aug 27, 2002
Sold by
The Ryland Group Inc
Bought by
Kelly David and Kelly Janice
Create a Home Valuation Report for This Property
The Home Valuation Report is an in-depth analysis detailing your home's value as well as a comparison with similar homes in the area
Home Values in the Area
Average Home Value in this Area
Purchase History
| Date | Buyer | Sale Price | Title Company |
|---|---|---|---|
| Redding Lisa M | -- | None Available | |
| Redding Gregory L | -- | None Available | |
| Redding Gregory L | $186,000 | None Available | |
| Kelly David | $164,921 | -- |
Source: Public Records
Mortgage History
| Date | Status | Borrower | Loan Amount |
|---|---|---|---|
| Open | Redding Gregory L | $192,850 | |
| Previous Owner | Redding Gregory L | $148,800 |
Source: Public Records
Tax History
| Year | Tax Paid | Tax Assessment Tax Assessment Total Assessment is a certain percentage of the fair market value that is determined by local assessors to be the total taxable value of land and additions on the property. | Land | Improvement |
|---|---|---|---|---|
| 2022 | $1,229 | $7,484 | $992 | $6,492 |
| 2021 | $1,229 | $7,484 | $992 | $6,492 |
| 2020 | $1,207 | $7,484 | $992 | $6,492 |
| 2019 | $1,204 | $7,484 | $992 | $6,492 |
| 2018 | $1,150 | $7,484 | $992 | $6,492 |
| 2017 | $994 | $6,508 | $1,040 | $5,468 |
| 2016 | $959 | $6,508 | $1,040 | $5,468 |
| 2015 | $932 | $6,508 | $1,040 | $5,468 |
| 2014 | $934 | $6,508 | $1,040 | $5,468 |
Source: Public Records
Map
Nearby Homes
- 213 Golden Bear Walk
- 118 Moonshadow Ct
- 136 Bellweather Dr
- 737 Stilmore Dr
- 714 Thistlewood Dr
- 105 Viewmont Dr
- 642 Grantleigh Dr
- 638 Grantleigh Dr
- 503 Torrington Dr
- 3048 Olivette Place
- 311 Rossmoor Ct
- 820 Redmill Ln
- 1312 Duncan Reidville Rd
- 424 Granbury Dr
- 141 Agnes Dr
- 636 Sunwater Dr
- 147 Bearden Dr
- 809 Jadeite Way
- 436 & 438 Berry Shoals Rd
- 159 Rockingham Rd
- 315 Nightshade Ln
- 127 Rogers Mill Dr
- 409 N Musgrove Ln
- 123 Rogers Mill Dr
- 312 Nightshade Ln
- 413 N Musgrove Ln
- 308 Nightshade Ln
- 316 Nightshade Ln
- 119 Rogers Mill Dr
- 304 Nightshade Ln
- 402 N Musgrove Ln
- 406 N Musgrove Ln
- 201 S Musgrove Ln
- 410 N Musgrove Ln
- 421 N Musgrove Ln
- 210 S Musgrove Ln
- 115 Rogers Mill Dr
- 126 Rogers Mill Dr
- 120 Rogers Mill Dr
- 130 Rogers Mill Dr
Your Personal Tour Guide
Ask me questions while you tour the home.