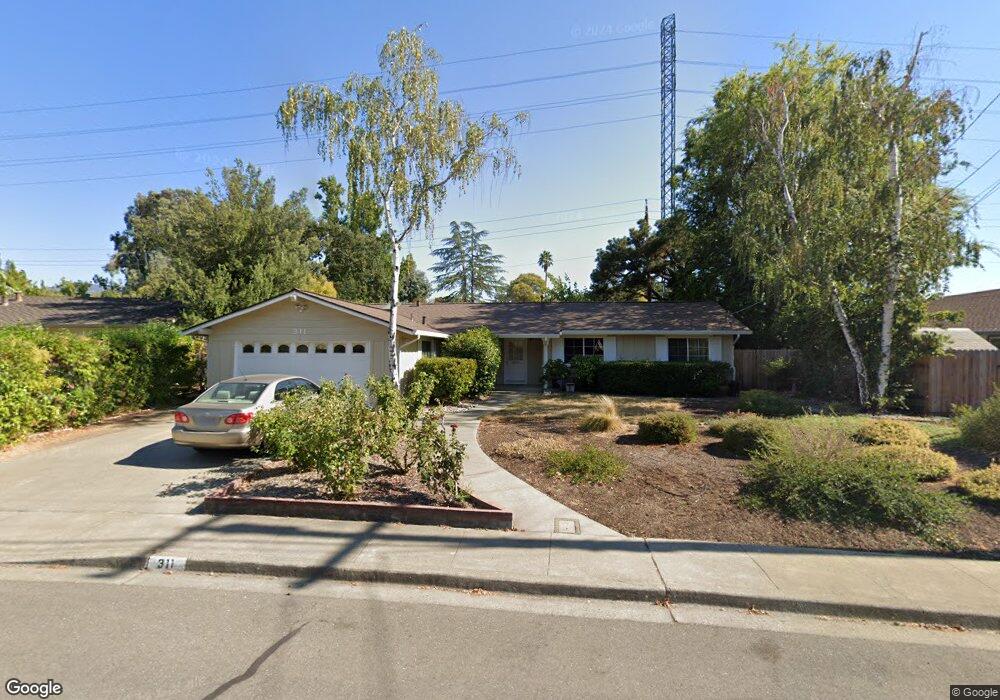
311 Pickering Place Walnut Creek, CA 94598
Brooktree North NeighborhoodEstimated Value: $1,340,000 - $1,482,000
3
Beds
2
Baths
1,603
Sq Ft
$876/Sq Ft
Est. Value
About This Home
This home is located at 311 Pickering Place, Walnut Creek, CA 94598 and is currently estimated at $1,403,513, approximately $875 per square foot. 311 Pickering Place is a home located in Contra Costa County with nearby schools including Walnut Acres Elementary School, Foothill Middle School, and Northgate High School.
Ownership History
Date
Name
Owned For
Owner Type
Purchase Details
Closed on
Aug 26, 2021
Sold by
Lee Erik Phillip and Cashmore Kristen
Bought by
Cashmore Kristen and Lee Erik Phillip
Current Estimated Value
Home Financials for this Owner
Home Financials are based on the most recent Mortgage that was taken out on this home.
Original Mortgage
$320,526
Outstanding Balance
$244,659
Interest Rate
2.1%
Mortgage Type
New Conventional
Estimated Equity
$1,158,854
Purchase Details
Closed on
May 24, 2021
Sold by
Cashmore Kristen and Lee Erik Philip
Bought by
Cashmore Kristen and Lee Erik Philip
Purchase Details
Closed on
Apr 29, 2021
Sold by
Lee Erik P and Cashmore Kristen
Bought by
Cashmore Kristen and Lee Erik Philip
Purchase Details
Closed on
Aug 11, 2009
Sold by
Lopez Daniel and Shankel Jill
Bought by
Lee Erik P and Cashmore Kristen
Home Financials for this Owner
Home Financials are based on the most recent Mortgage that was taken out on this home.
Original Mortgage
$488,000
Interest Rate
5.3%
Mortgage Type
Purchase Money Mortgage
Purchase Details
Closed on
May 16, 2002
Sold by
Lin Baiwei and Yan Shuxin
Bought by
Lopez Daniel and Shankel Jill
Home Financials for this Owner
Home Financials are based on the most recent Mortgage that was taken out on this home.
Original Mortgage
$379,000
Interest Rate
6.94%
Mortgage Type
Purchase Money Mortgage
Purchase Details
Closed on
Nov 1, 1995
Sold by
Lin Baiwei and Yan Shuxin
Bought by
Yan Shuxin and Lin Baiwei
Home Financials for this Owner
Home Financials are based on the most recent Mortgage that was taken out on this home.
Original Mortgage
$203,150
Interest Rate
7.62%
Mortgage Type
Purchase Money Mortgage
Purchase Details
Closed on
Jun 9, 1994
Sold by
Zuttermeister Mary Jean
Bought by
Yan Shuxin and Lin Baiwei
Home Financials for this Owner
Home Financials are based on the most recent Mortgage that was taken out on this home.
Original Mortgage
$241,200
Interest Rate
5.87%
Mortgage Type
Purchase Money Mortgage
Create a Home Valuation Report for This Property
The Home Valuation Report is an in-depth analysis detailing your home's value as well as a comparison with similar homes in the area
Home Values in the Area
Average Home Value in this Area
Purchase History
| Date | Buyer | Sale Price | Title Company |
|---|---|---|---|
| Cashmore Kristen | -- | Mortgage Connect Lp | |
| Lee Erik Phillip | -- | Mortgage Connect Lp | |
| Cashmore Kristen | -- | None Available | |
| Cashmore Kristen | -- | None Available | |
| Lee Erik P | $610,000 | North American Title Company | |
| Lopez Daniel | $548,500 | American Title Co | |
| Yan Shuxin | -- | Old Republic Title Company | |
| Yan Shuxin | $268,000 | Chicago Title Company |
Source: Public Records
Mortgage History
| Date | Status | Borrower | Loan Amount |
|---|---|---|---|
| Open | Lee Erik Phillip | $320,526 | |
| Closed | Lee Erik P | $488,000 | |
| Previous Owner | Lopez Daniel | $379,000 | |
| Previous Owner | Yan Shuxin | $203,150 | |
| Previous Owner | Yan Shuxin | $241,200 |
Source: Public Records
Tax History Compared to Growth
Tax History
| Year | Tax Paid | Tax Assessment Tax Assessment Total Assessment is a certain percentage of the fair market value that is determined by local assessors to be the total taxable value of land and additions on the property. | Land | Improvement |
|---|---|---|---|---|
| 2025 | $9,344 | $787,387 | $658,314 | $129,073 |
| 2024 | $9,192 | $771,949 | $645,406 | $126,543 |
| 2023 | $9,192 | $756,813 | $632,751 | $124,062 |
| 2022 | $9,112 | $741,975 | $620,345 | $121,630 |
| 2021 | $8,908 | $727,428 | $608,182 | $119,246 |
| 2019 | $8,715 | $705,854 | $590,144 | $115,710 |
| 2018 | $8,401 | $692,015 | $578,573 | $113,442 |
| 2017 | $8,133 | $678,447 | $567,229 | $111,218 |
| 2016 | $7,939 | $665,145 | $556,107 | $109,038 |
| 2015 | $7,882 | $655,155 | $547,754 | $107,401 |
| 2014 | $7,778 | $642,323 | $537,025 | $105,298 |
Source: Public Records
Map
Nearby Homes
- 567 Cabot Ct
- 1936 Nero Ct
- 295 Kinross Dr
- 1031 Millbrook Ct
- 849 Tampico
- 1032 Millbrook Ct
- 1960 Pomar Way
- 1513 Siskiyou Dr
- 817 Cheyenne Dr
- 1411 Marchbanks Dr Unit 2
- 1471 Marchbanks Dr Unit 4
- 1463 Marchbanks Dr Unit 2
- 1417 Marchbanks Dr Unit 4
- 500 Tampico
- 1053 Arkell Rd
- 1457 Marchbanks Dr Unit 1
- 205 Masters Ct Unit 3
- 1605 Countrywood Ct
- 407 Tampico
- 1624 Countrywood Ct
- 203 Warwick Dr
- 321 Pickering Place
- 217 Warwick Dr
- 324 El Divisadero Ave
- 316 Pickering Place
- 333 Pickering Place
- 330 El Divisadero Ave
- 175 Warwick Dr
- 204 Warwick Dr
- 229 Warwick Dr
- 330 Pickering Place
- 336 El Divisadero Ave
- 176 Warwick Dr
- 318 El Divisadero Ave
- 161 Warwick Dr
- 342 El Divisadero Ave
- 285 Pickering Place
- 339 Pickering Place
- 218 Warwick Dr
- 340 Pickering Place