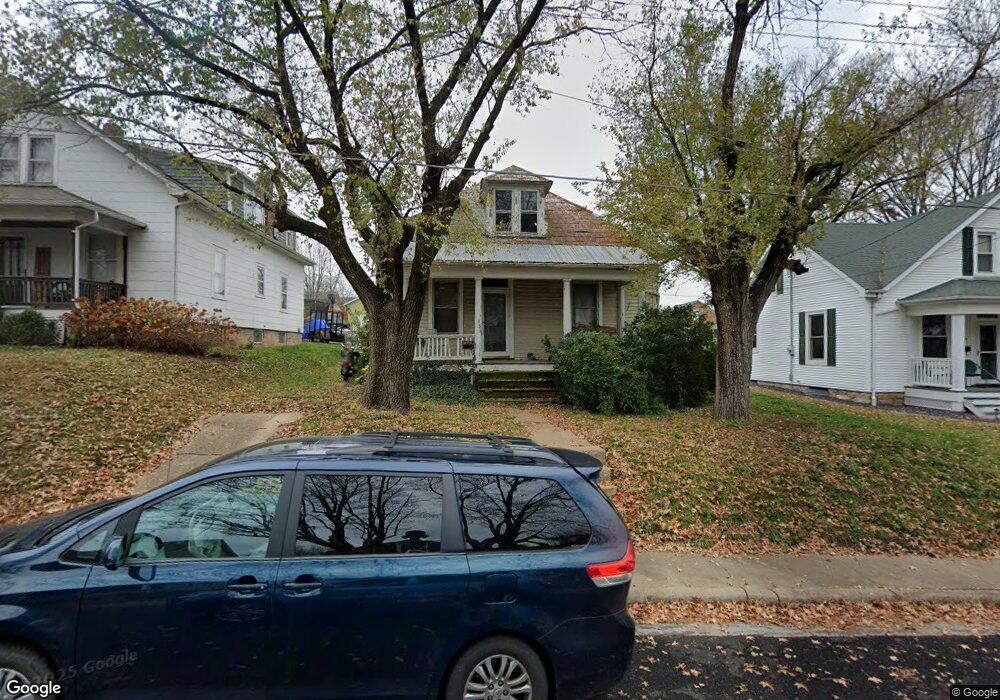
311 Rand St Washington, MO 63090
Estimated Value: $199,186 - $228,000
2
Beds
2
Baths
1,442
Sq Ft
$150/Sq Ft
Est. Value
About This Home
This home is located at 311 Rand St, Washington, MO 63090 and is currently estimated at $216,062, approximately $149 per square foot. 311 Rand St is a home located in Franklin County with nearby schools including Washington High School, Washington Montessori School, and St. Francis Borgia Catholic School.
Ownership History
Date
Name
Owned For
Owner Type
Purchase Details
Closed on
Feb 25, 2011
Sold by
Yeary Sheila R
Bought by
Yeary Kendall W
Current Estimated Value
Purchase Details
Closed on
Nov 18, 2010
Sold by
Yeary Kendall W and Yeary Sheila R
Bought by
Yeary Kendall W
Home Financials for this Owner
Home Financials are based on the most recent Mortgage that was taken out on this home.
Original Mortgage
$84,000
Interest Rate
4.41%
Mortgage Type
New Conventional
Create a Home Valuation Report for This Property
The Home Valuation Report is an in-depth analysis detailing your home's value as well as a comparison with similar homes in the area
Home Values in the Area
Average Home Value in this Area
Purchase History
| Date | Buyer | Sale Price | Title Company |
|---|---|---|---|
| Yeary Kendall W | -- | None Available | |
| Yeary Kendall W | -- | None Available |
Source: Public Records
Mortgage History
| Date | Status | Borrower | Loan Amount |
|---|---|---|---|
| Closed | Yeary Kendall W | $84,000 |
Source: Public Records
Tax History
| Year | Tax Paid | Tax Assessment Tax Assessment Total Assessment is a certain percentage of the fair market value that is determined by local assessors to be the total taxable value of land and additions on the property. | Land | Improvement |
|---|---|---|---|---|
| 2025 | $1,251 | $22,435 | $0 | $0 |
| 2024 | $1,251 | $19,502 | $0 | $0 |
| 2023 | $1,108 | $19,502 | $0 | $0 |
| 2022 | $1,102 | $19,386 | $0 | $0 |
| 2021 | $1,099 | $19,386 | $0 | $0 |
| 2020 | $1,020 | $17,326 | $0 | $0 |
| 2019 | $1,018 | $17,326 | $0 | $0 |
| 2018 | $926 | $15,926 | $0 | $0 |
| 2017 | $925 | $15,926 | $0 | $0 |
| 2016 | $881 | $15,443 | $0 | $0 |
| 2015 | $881 | $15,443 | $0 | $0 |
| 2014 | $882 | $15,472 | $0 | $0 |
Source: Public Records
Map
Nearby Homes
- 305 Williams St
- 341 Mclean Ave
- 720 Horn St Unit 108
- 730 Horn St Unit 102
- 403 Frank St
- 19-21 Village West Ct Unit 102
- 19-21 Village West Ct Unit 302
- 17 Village West Ct Unit 101
- 7 Village Ct W Unit 201
- 15 Village West Ct Unit 302
- 341 Stafford St
- 413 Stafford St
- 512 W 2nd St
- 919 W Main St
- 405 Cedar St
- 1221 W 7th St
- 611 Elm St
- 805 Clay St
- 110 E 6th St
- 208 E 6th St
Your Personal Tour Guide
Ask me questions while you tour the home.