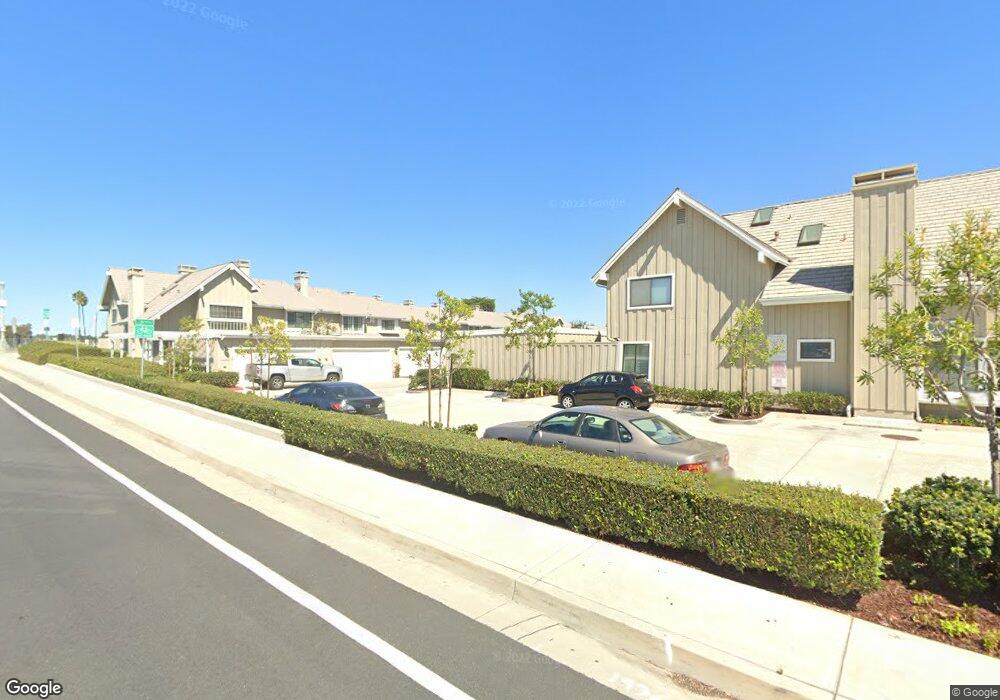
311 Regatta Way Seal Beach, CA 90740
Estimated Value: $1,338,799 - $1,614,000
2
Beds
3
Baths
1,428
Sq Ft
$1,029/Sq Ft
Est. Value
About This Home
This home is located at 311 Regatta Way, Seal Beach, CA 90740 and is currently estimated at $1,468,950, approximately $1,028 per square foot. 311 Regatta Way is a home located in Orange County with nearby schools including J. H. Mcgaugh Elementary School, Jack L. Weaver Elementary School, and Sharon Christa Mcauliffe Middle School.
Ownership History
Date
Name
Owned For
Owner Type
Purchase Details
Closed on
May 6, 2025
Sold by
Gorgen C Douglas
Bought by
Clement Douglas Gorgen Trust and Gorgen
Current Estimated Value
Purchase Details
Closed on
Oct 11, 2005
Sold by
Gorgen Karen L and Gorgen Douglas Gorgen
Bought by
Gorgen Karen L and Gorgen Douglas Gorgen
Purchase Details
Closed on
Mar 14, 2005
Sold by
Redlin Carl M and Redlin Kay G
Bought by
Gorgen Karen L and Gorgen Douglas Gorgen
Purchase Details
Closed on
Feb 12, 2001
Sold by
Romeyn Thomas A
Bought by
Redlin Carl M and Redlin Kay G
Purchase Details
Closed on
Aug 16, 1999
Sold by
Thomas Romeyn
Bought by
Romeyn Thomas A and Thomas A Romeyn Declaration Of Trust
Purchase Details
Closed on
Feb 12, 1998
Sold by
Overgaard Arthur D
Bought by
Romeyn Thomas A
Create a Home Valuation Report for This Property
The Home Valuation Report is an in-depth analysis detailing your home's value as well as a comparison with similar homes in the area
Home Values in the Area
Average Home Value in this Area
Purchase History
| Date | Buyer | Sale Price | Title Company |
|---|---|---|---|
| Clement Douglas Gorgen Trust | -- | None Listed On Document | |
| Gorgen Karen L | -- | -- | |
| Gorgen Karen L | $720,000 | Lawyers Title | |
| Redlin Carl M | $460,000 | Fidelity National Title | |
| Romeyn Thomas A | -- | -- | |
| Romeyn Thomas A | $325,000 | Commonwealth Land Title |
Source: Public Records
Tax History Compared to Growth
Tax History
| Year | Tax Paid | Tax Assessment Tax Assessment Total Assessment is a certain percentage of the fair market value that is determined by local assessors to be the total taxable value of land and additions on the property. | Land | Improvement |
|---|---|---|---|---|
| 2025 | $4,019 | $317,223 | $195,879 | $121,344 |
| 2024 | $4,019 | $311,003 | $192,038 | $118,965 |
| 2023 | $3,921 | $304,905 | $188,272 | $116,633 |
| 2022 | $3,868 | $298,927 | $184,580 | $114,347 |
| 2021 | $3,779 | $293,066 | $180,961 | $112,105 |
| 2020 | $3,773 | $290,061 | $179,105 | $110,956 |
| 2019 | $3,661 | $284,374 | $175,593 | $108,781 |
| 2018 | $3,501 | $278,799 | $172,150 | $106,649 |
| 2017 | $3,424 | $273,333 | $168,775 | $104,558 |
| 2016 | $3,356 | $267,974 | $165,466 | $102,508 |
| 2015 | $3,308 | $263,949 | $162,980 | $100,969 |
| 2014 | $3,225 | $258,779 | $159,787 | $98,992 |
Source: Public Records
Map
Nearby Homes
- 313 Regatta Way
- 315 Regatta Way
- 317 Regatta Way
- 309 Regatta Way
- 319 Regatta Way
- 307 Regatta Way
- 305 Regatta Way
- 321 Regatta Way
- 303 Regatta Way
- 323 Regatta Way
- 312 Regatta Way
- 314 Regatta Way
- 316 Regatta Way
- 310 Regatta Way
- 318 Regatta Way
- 301 Regatta Way
- 325 Regatta Way
- 308 Regatta Way
- 320 Regatta Way
- 306 Regatta Way