311 Rose Ave Marion, OH 43302
Estimated Value: $338,225
--
Bed
--
Bath
17,935
Sq Ft
$19/Sq Ft
Est. Value
About This Home
This home is located at 311 Rose Ave, Marion, OH 43302 and is currently priced at $338,225, approximately $18 per square foot. 311 Rose Ave is a home located in Marion County with nearby schools including Rutherford B. Hayes Elementary School, Ulysses S. Grant Middle School, and Harding High School.
Ownership History
Date
Name
Owned For
Owner Type
Purchase Details
Closed on
Nov 3, 2025
Sold by
Stooksbury Justin
Bought by
Haunted Hoorah Land Holdings Llc
Current Estimated Value
Purchase Details
Closed on
Feb 21, 2020
Bought by
Stooksbury Justin
Home Financials for this Owner
Home Financials are based on the most recent Mortgage that was taken out on this home.
Interest Rate
3.49%
Purchase Details
Closed on
Jun 27, 2014
Bought by
Sims Bros Inc
Purchase Details
Closed on
Oct 26, 2010
Sold by
Beartrax Llc
Bought by
Jesbar Llc
Purchase Details
Closed on
Oct 12, 2007
Sold by
The Pioneer City Casting Co
Bought by
Beartrax Llc
Purchase Details
Closed on
Apr 2, 2007
Sold by
Pioneer City Alloys Inc
Bought by
The Pioneer City Castine Co
Purchase Details
Closed on
Apr 15, 2002
Bought by
Sims Bros Inc
Create a Home Valuation Report for This Property
The Home Valuation Report is an in-depth analysis detailing your home's value as well as a comparison with similar homes in the area
Home Values in the Area
Average Home Value in this Area
Purchase History
| Date | Buyer | Sale Price | Title Company |
|---|---|---|---|
| Haunted Hoorah Land Holdings Llc | $58,100 | None Listed On Document | |
| Stooksbury Justin | $130,000 | -- | |
| Sims Bros Inc | $40,000 | -- | |
| Jesbar Llc | -- | None Available | |
| Beartrax Llc | $175,000 | Chicago Title | |
| The Pioneer City Castine Co | -- | None Available | |
| Sims Bros Inc | $30,000 | -- |
Source: Public Records
Mortgage History
| Date | Status | Borrower | Loan Amount |
|---|---|---|---|
| Previous Owner | Stooksbury Justin | -- |
Source: Public Records
Tax History Compared to Growth
Tax History
| Year | Tax Paid | Tax Assessment Tax Assessment Total Assessment is a certain percentage of the fair market value that is determined by local assessors to be the total taxable value of land and additions on the property. | Land | Improvement |
|---|---|---|---|---|
| 2024 | $946 | $20,320 | $20,320 | $0 |
| 2023 | $946 | $20,320 | $20,320 | $0 |
| 2022 | $3,681 | $20,320 | $20,320 | $0 |
| 2021 | $952 | $20,320 | $20,320 | $0 |
| 2020 | $985 | $20,320 | $20,320 | $0 |
| 2019 | $981 | $20,320 | $20,320 | $0 |
| 2018 | $1,072 | $22,670 | $20,320 | $2,350 |
| 2017 | $1,077 | $22,670 | $20,320 | $2,350 |
| 2016 | $1,077 | $22,670 | $20,320 | $2,350 |
| 2015 | $1,088 | $22,670 | $20,320 | $2,350 |
| 2014 | $1,092 | $22,670 | $20,320 | $2,350 |
| 2012 | $2,083 | $42,850 | $21,370 | $21,480 |
Source: Public Records
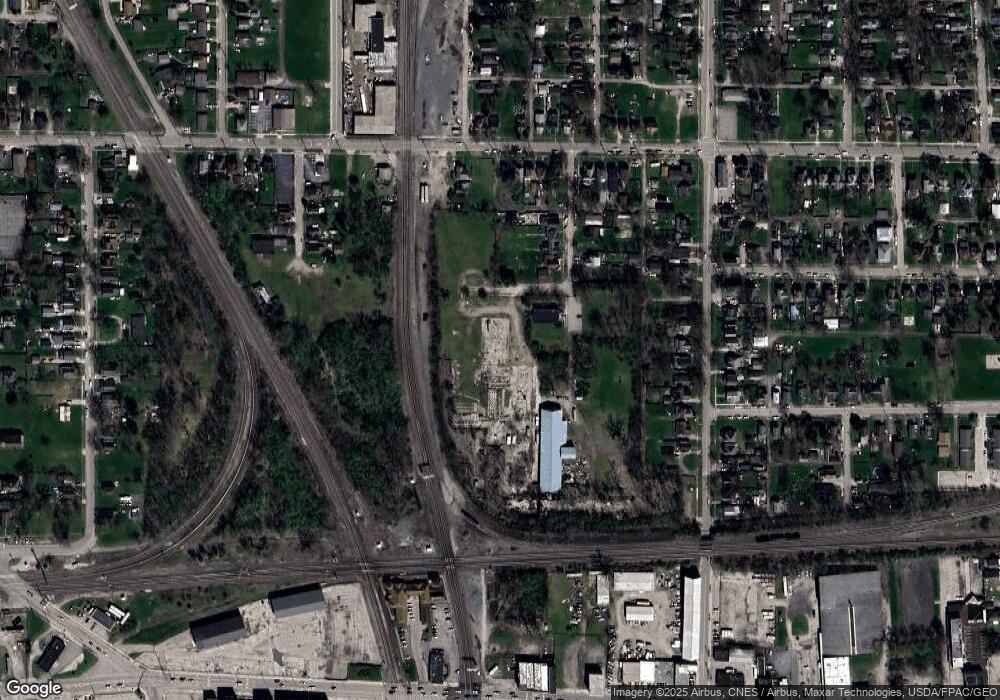
Map
Nearby Homes
- 178 Leader St
- 343 Commercial St
- 325 Holmes Place
- 347 Mary St
- 468 Avondale Ave
- 374 Nunin Ct
- 233 Tully St
- 485 Avondale Ave
- 213 Sharp St
- 429 W Columbia St
- 134 Waterloo St
- 520 Toledo Ave
- 302 Blaine Ave
- 531 Toledo Ave
- 551 Universal Ave Unit 555
- 314 Windsor St
- 641 Blake Ave
- 395 N Main St
- 355 Lee St
- 229 W Columbia St