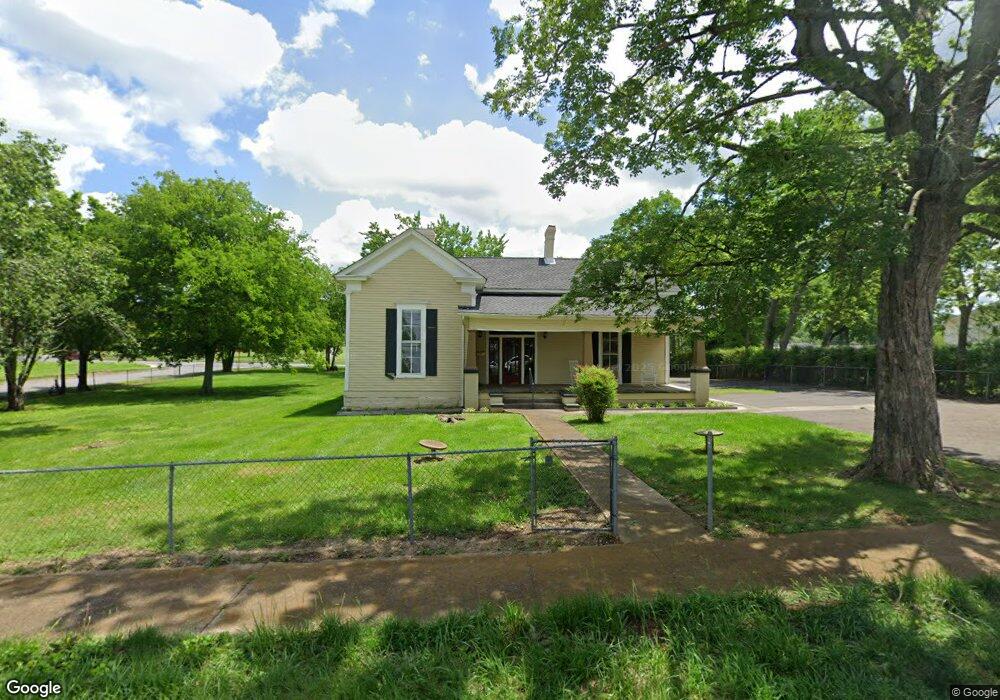
311 S Brittain St Shelbyville, TN 37160
Estimated Value: $227,343 - $346,000
--
Bed
2
Baths
2,194
Sq Ft
$137/Sq Ft
Est. Value
About This Home
This home is located at 311 S Brittain St, Shelbyville, TN 37160 and is currently estimated at $299,586, approximately $136 per square foot. 311 S Brittain St is a home located in Bedford County with nearby schools including East Side Elementary School, Harris Middle School, and Christian Chapel Academy.
Ownership History
Date
Name
Owned For
Owner Type
Purchase Details
Closed on
Jun 23, 2009
Sold by
Seckler Jeffrey K
Bought by
Durard Forest A
Current Estimated Value
Home Financials for this Owner
Home Financials are based on the most recent Mortgage that was taken out on this home.
Original Mortgage
$112,000
Interest Rate
4.88%
Purchase Details
Closed on
Dec 17, 2001
Sold by
Legate Joan E and Legate John R
Bought by
Sekler Jeffrey K
Home Financials for this Owner
Home Financials are based on the most recent Mortgage that was taken out on this home.
Original Mortgage
$6,277
Interest Rate
6.49%
Purchase Details
Closed on
Dec 1, 2000
Sold by
Raby Byrd J
Bought by
Legate Joan
Purchase Details
Closed on
Dec 5, 1995
Sold by
Thordsen Robert A
Bought by
Craig Lillie L
Purchase Details
Closed on
Jul 31, 1981
Bought by
Thordsen Robert A
Purchase Details
Closed on
Nov 24, 1978
Create a Home Valuation Report for This Property
The Home Valuation Report is an in-depth analysis detailing your home's value as well as a comparison with similar homes in the area
Home Values in the Area
Average Home Value in this Area
Purchase History
| Date | Buyer | Sale Price | Title Company |
|---|---|---|---|
| Durard Forest A | $132,500 | -- | |
| Sekler Jeffrey K | $124,900 | -- | |
| Legate Joan | $37,500 | -- | |
| Craig Lillie L | $40,000 | -- | |
| Thordsen Robert A | -- | -- | |
| -- | -- | -- |
Source: Public Records
Mortgage History
| Date | Status | Borrower | Loan Amount |
|---|---|---|---|
| Closed | Not Available | $112,000 | |
| Previous Owner | Not Available | $6,277 |
Source: Public Records
Tax History Compared to Growth
Tax History
| Year | Tax Paid | Tax Assessment Tax Assessment Total Assessment is a certain percentage of the fair market value that is determined by local assessors to be the total taxable value of land and additions on the property. | Land | Improvement |
|---|---|---|---|---|
| 2025 | -- | $73,480 | $0 | $0 |
| 2024 | -- | $73,480 | $17,800 | $55,680 |
| 2023 | $2,797 | $73,480 | $17,800 | $55,680 |
| 2022 | $2,877 | $73,480 | $17,800 | $55,680 |
| 2021 | $2,612 | $73,480 | $17,800 | $55,680 |
| 2020 | $2,564 | $73,480 | $17,800 | $55,680 |
| 2019 | $2,564 | $57,880 | $13,200 | $44,680 |
| 2018 | $2,506 | $57,880 | $13,200 | $44,680 |
| 2017 | $2,506 | $57,880 | $13,200 | $44,680 |
| 2016 | $2,483 | $57,880 | $13,200 | $44,680 |
| 2015 | $2,483 | $57,880 | $13,200 | $44,680 |
| 2014 | $2,231 | $56,914 | $0 | $0 |
Source: Public Records
Map
Nearby Homes
- 220 Walnut St
- 0 E Depot St
- 709 Belmont Ave
- 120 Dogwood Ct
- 418 Riverview Dr
- 527 Deery St
- 464 Whitthorne St
- 112 Elizabeth St
- 222 Carter St
- 207 Martha St
- 713 King Ave
- 627 E Lane St
- 102 Germantown Rd
- 714 King Ave
- 508 Lewis Ave
- 631 E Lane St
- 211 S Fairoak St
- 0 Hilltop Rd Unit RTC2897754
- 0 Hilltop Rd Unit RTC3001632
- 611 Coble Cir
- 315 S Brittain St
- 301 S Brittain St
- 310 S Brittain St
- 319 S Brittain St
- 321 S Brittain St
- 217 S Main St
- 315 S Main St
- 323 S Brittain St
- 810 S Main St
- 315 S Main St 315 & 317
- 316 S Main St
- 401 Elliott St
- 210 S Main St
- 405 Elliott St
- 409 Elliott St
- 411 Elliott St
- 415 Elliott St
- 208 Depot St
- 206 Depot St
- 202 E Depot St