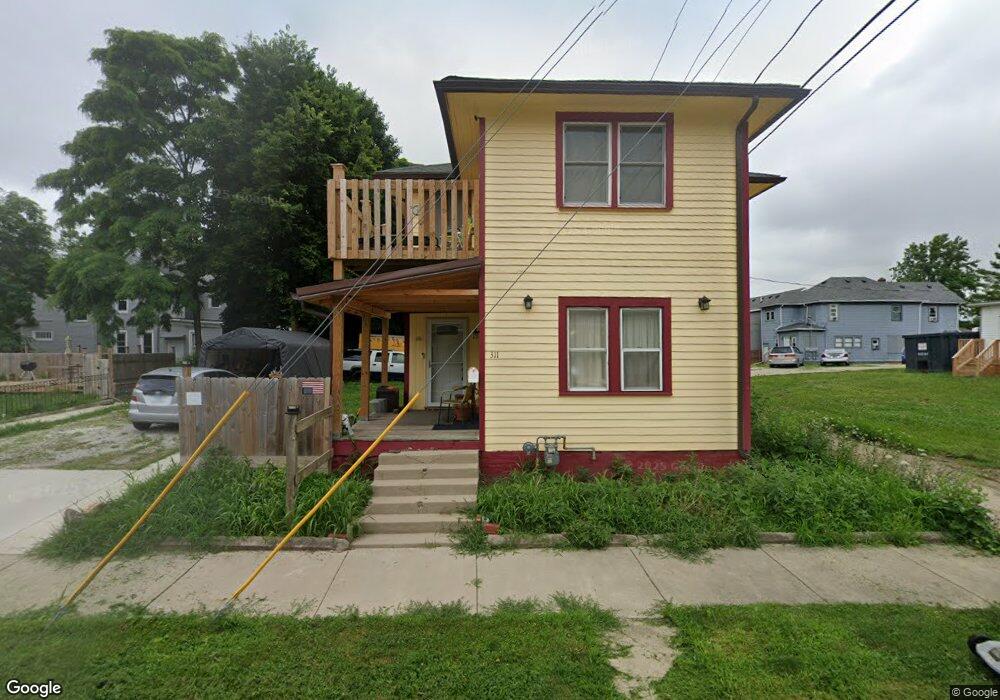
311 S Gharkey St Muncie, IN 47305
Old West End NeighborhoodEstimated Value: $55,853 - $104,000
3
Beds
2
Baths
1,304
Sq Ft
$57/Sq Ft
Est. Value
About This Home
This home is located at 311 S Gharkey St, Muncie, IN 47305 and is currently estimated at $74,213, approximately $56 per square foot. 311 S Gharkey St is a home located in Delaware County with nearby schools including Muncie Central High School, South View Elementary School, and Northside Middle School.
Ownership History
Date
Name
Owned For
Owner Type
Purchase Details
Closed on
Apr 22, 2025
Sold by
Jj Mason Llc
Bought by
Bradley Kevin Burkart Revocable Living Trust
Current Estimated Value
Purchase Details
Closed on
Oct 8, 2019
Sold by
Mcnett Sherry A and Williams Joshua S
Bought by
Jj Mason Llc
Purchase Details
Closed on
Nov 16, 2009
Sold by
Mcnett Sherry
Bought by
Miller Thearon and Miller Nicole
Home Financials for this Owner
Home Financials are based on the most recent Mortgage that was taken out on this home.
Original Mortgage
$72,000
Interest Rate
4.95%
Mortgage Type
Seller Take Back
Create a Home Valuation Report for This Property
The Home Valuation Report is an in-depth analysis detailing your home's value as well as a comparison with similar homes in the area
Home Values in the Area
Average Home Value in this Area
Purchase History
| Date | Buyer | Sale Price | Title Company |
|---|---|---|---|
| Bradley Kevin Burkart Revocable Living Trust | -- | None Listed On Document | |
| Jj Mason Llc | -- | None Available | |
| Miller Thearon | $72,000 | None Available |
Source: Public Records
Mortgage History
| Date | Status | Borrower | Loan Amount |
|---|---|---|---|
| Previous Owner | Miller Thearon | $72,000 |
Source: Public Records
Tax History Compared to Growth
Tax History
| Year | Tax Paid | Tax Assessment Tax Assessment Total Assessment is a certain percentage of the fair market value that is determined by local assessors to be the total taxable value of land and additions on the property. | Land | Improvement |
|---|---|---|---|---|
| 2024 | $848 | $37,000 | $3,200 | $33,800 |
| 2023 | $1,179 | $30,900 | $2,700 | $28,200 |
| 2022 | $694 | $29,300 | $2,700 | $26,600 |
| 2021 | $542 | $21,700 | $3,500 | $18,200 |
| 2020 | $528 | $21,000 | $3,500 | $17,500 |
| 2019 | $352 | $12,200 | $3,500 | $8,700 |
| 2018 | $398 | $11,800 | $3,500 | $8,300 |
| 2017 | $348 | $12,000 | $3,500 | $8,500 |
| 2016 | $228 | $12,000 | $3,500 | $8,500 |
| 2014 | $63 | $13,300 | $3,300 | $10,000 |
| 2013 | -- | $12,800 | $3,200 | $9,600 |
Source: Public Records
Map
Nearby Homes
- 312 S Gharkey St
- 725 W Charles St
- 429 W Charles St
- 407 W Adams St
- 303 S Proud St
- 305 S Proud St
- 502 S Mound St
- 415 W Howard St
- 27 W Orchard Place
- 925 W Powers St
- 1024 W Powers St
- 1008 W 1st St
- 114 S Walnut St
- 114 S Walnut St Unit 100 & 200
- 1319 W Kilgore Ave
- 709 W Riverside Ave
- 709 N Wheeling Ave
- 601 W Riverside Ave
- 429 W 6th St
- 1303 S Liberty St
- 708 W Charles St
- 710 W Charles St
- 622 W Charles St
- 622 W Charles St Unit MUNCIE
- 622 W Charles St Unit 1-3
- 709 W Adams St
- 714 W Charles St
- 713 W Adams St
- 718 W Charles St
- 619 W Adams St
- 715 W Adams St
- 619 W Adams St
- 619 W Adams St
- 614 W Charles St
- 614 W Charles St Unit 2
- 614 W Charles St Unit 1
- 614 W Charles St Unit 3
- 617 W Adams St
- 310 S Mound St
- 722 W Charles St