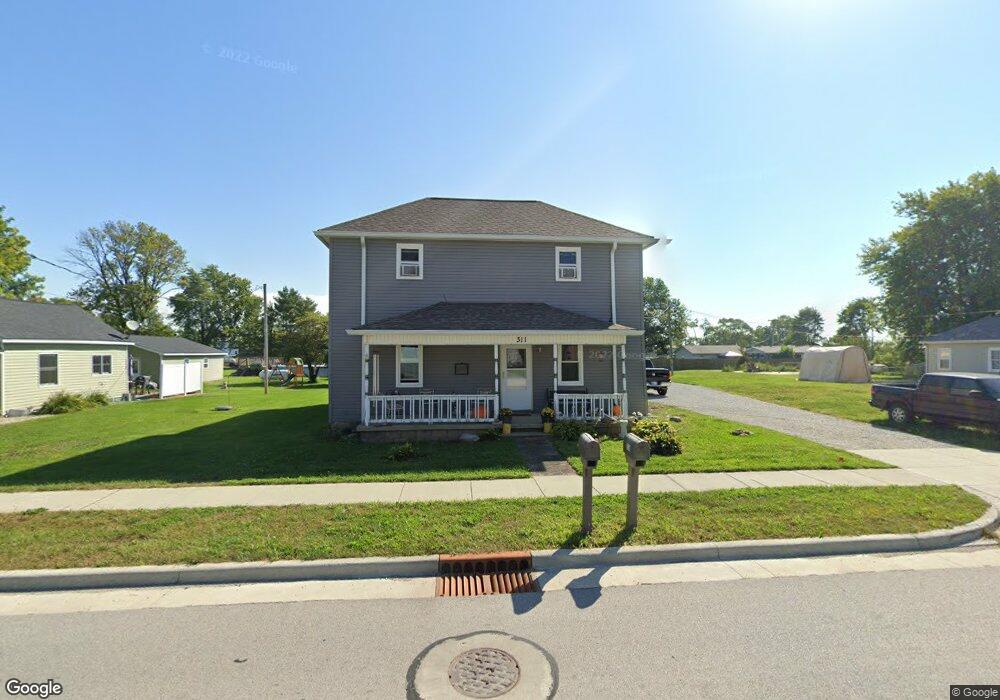
311 S Main St Advance, IN 46102
Estimated Value: $239,000 - $288,000
6
Beds
3
Baths
2,560
Sq Ft
$104/Sq Ft
Est. Value
About This Home
This home is located at 311 S Main St, Advance, IN 46102 and is currently estimated at $265,791, approximately $103 per square foot. 311 S Main St is a home located in Boone County with nearby schools including Western Boone Junior/Senior High School.
Ownership History
Date
Name
Owned For
Owner Type
Purchase Details
Closed on
Jun 14, 2019
Sold by
Lane Larry T
Bought by
Lane Rebecca L
Current Estimated Value
Purchase Details
Closed on
May 18, 2007
Sold by
Fannie Mae
Bought by
Lane Larry T and Lane Rebecca L
Home Financials for this Owner
Home Financials are based on the most recent Mortgage that was taken out on this home.
Original Mortgage
$8,000
Outstanding Balance
$5,369
Interest Rate
8.25%
Mortgage Type
Adjustable Rate Mortgage/ARM
Estimated Equity
$260,422
Purchase Details
Closed on
Oct 12, 2006
Sold by
Mckinney Truman J and Thompson Jannie L
Bought by
Chase Home Finance Llc
Purchase Details
Closed on
Oct 2, 2006
Sold by
Chase Home Finance Llc
Bought by
Federal National Mortgage Association
Create a Home Valuation Report for This Property
The Home Valuation Report is an in-depth analysis detailing your home's value as well as a comparison with similar homes in the area
Purchase History
We collect this data history from publicly available records. To have your information removed, we recommend requesting removal directly through your county’s website.
| Date | Buyer | Sale Price | Title Company |
|---|---|---|---|
| Lane Rebecca L | -- | None Available | |
| Lane Larry T | -- | -- | |
| Chase Home Finance Llc | $118,454 | -- | |
| Federal National Mortgage Association | -- | -- |
Source: Public Records
Mortgage History
We collect this data history from publicly available records. To have your information removed, we recommend requesting removal directly through your county’s website.
| Date | Status | Borrower | Loan Amount |
|---|---|---|---|
| Open | Lane Larry T | $8,000 |
Source: Public Records
Tax History
| Year | Tax Paid | Tax Assessment Tax Assessment Total Assessment is a certain percentage of the fair market value that is determined by local assessors to be the total taxable value of land and additions on the property. | Land | Improvement |
|---|---|---|---|---|
| 2025 | $2,243 | $246,700 | $16,600 | $230,100 |
| 2024 | $2,243 | $225,200 | $16,600 | $208,600 |
| 2023 | $2,075 | $206,300 | $16,600 | $189,700 |
| 2022 | $1,890 | $181,200 | $16,600 | $164,600 |
| 2021 | $1,699 | $160,900 | $16,600 | $144,300 |
| 2020 | $1,650 | $155,900 | $16,600 | $139,300 |
| 2019 | $1,294 | $132,700 | $16,600 | $116,100 |
| 2018 | $1,492 | $145,800 | $16,600 | $129,200 |
| 2017 | $1,400 | $140,400 | $16,600 | $123,800 |
| 2016 | $1,300 | $136,100 | $17,900 | $118,200 |
| 2014 | $1,159 | $129,000 | $17,900 | $111,100 |
| 2013 | $1,181 | $126,600 | $17,900 | $108,700 |
Source: Public Records
Map
Nearby Homes
- 307 E Wall St
- 9402 E County Road 400 N
- W Cr 400 S
- 7234 W 200 S
- 9136 W 500 S
- 5787 W 300 S
- 308 Blue Moon Way
- 9440 W County Road 400 S
- 5690 and 5790 W 300 S
- 4995 S 650 W
- 5827 S State Road 75
- 2802 County Road 600 S
- 750 S 500 W
- 5005 W 200 S
- 4835 S 500 W
- 6844 S State Road 75
- 679 S 1050 W
- Lot 1 - 4625 50 S
- Lot 2 - 4625 50 S
- 7273 S State Road 75
Your Personal Tour Guide
Ask me questions while you tour the home.