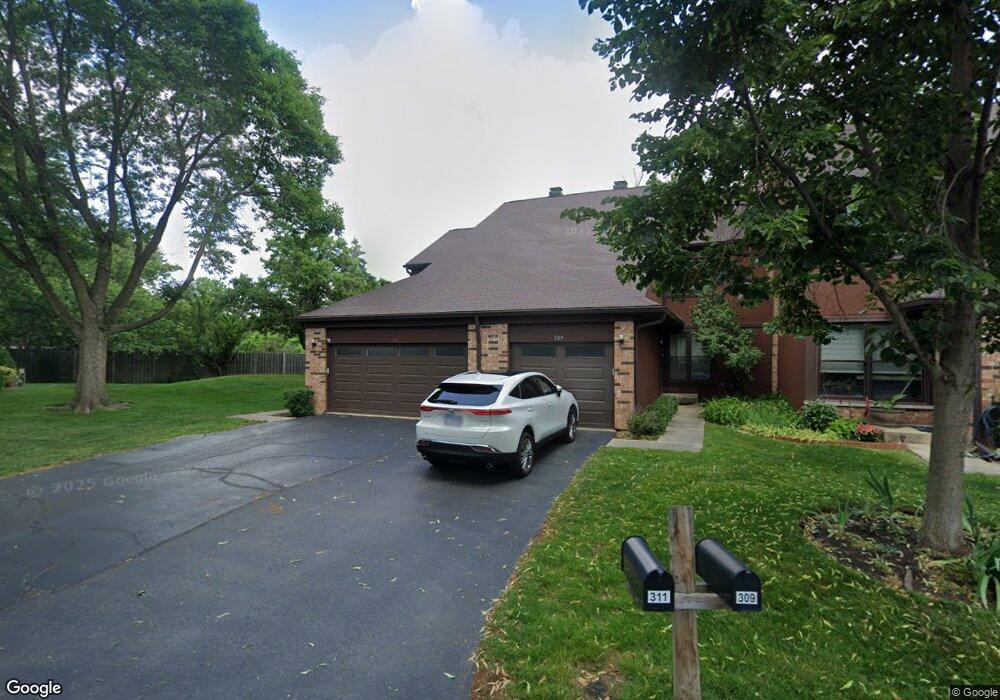
311 Shadowbend Dr Unit 3B Wheeling, IL 60090
Estimated Value: $284,000 - $336,971
3
Beds
2
Baths
1,402
Sq Ft
$223/Sq Ft
Est. Value
About This Home
This home is located at 311 Shadowbend Dr Unit 3B, Wheeling, IL 60090 and is currently estimated at $312,243, approximately $222 per square foot. 311 Shadowbend Dr Unit 3B is a home located in Cook County with nearby schools including Walt Whitman Elementary School, Oliver W Holmes Middle School, and Wheeling High School.
Ownership History
Date
Name
Owned For
Owner Type
Purchase Details
Closed on
Aug 14, 2019
Sold by
Chang Wesley C and Chang Linda S
Bought by
Pshenov Simon
Current Estimated Value
Home Financials for this Owner
Home Financials are based on the most recent Mortgage that was taken out on this home.
Original Mortgage
$146,000
Outstanding Balance
$127,033
Interest Rate
3.7%
Mortgage Type
New Conventional
Estimated Equity
$185,210
Purchase Details
Closed on
Jan 12, 2007
Sold by
Chang Wesley C
Bought by
Chang Wesley C and Chang Linda S
Purchase Details
Closed on
Oct 30, 1998
Sold by
Dicola Renzo F and Dicola Anna
Bought by
Chang Wesley C
Home Financials for this Owner
Home Financials are based on the most recent Mortgage that was taken out on this home.
Original Mortgage
$162,150
Interest Rate
7.01%
Mortgage Type
VA
Purchase Details
Closed on
Jul 27, 1994
Sold by
Dicola Joann
Bought by
Dicola Renzo F
Create a Home Valuation Report for This Property
The Home Valuation Report is an in-depth analysis detailing your home's value as well as a comparison with similar homes in the area
Home Values in the Area
Average Home Value in this Area
Purchase History
| Date | Buyer | Sale Price | Title Company |
|---|---|---|---|
| Pshenov Simon | $172,000 | Attorney | |
| Chang Wesley C | -- | None Available | |
| Chang Wesley C | $163,000 | -- | |
| Dicola Renzo F | -- | -- |
Source: Public Records
Mortgage History
| Date | Status | Borrower | Loan Amount |
|---|---|---|---|
| Open | Pshenov Simon | $146,000 | |
| Previous Owner | Chang Wesley C | $162,150 |
Source: Public Records
Tax History
| Year | Tax Paid | Tax Assessment Tax Assessment Total Assessment is a certain percentage of the fair market value that is determined by local assessors to be the total taxable value of land and additions on the property. | Land | Improvement |
|---|---|---|---|---|
| 2025 | $6,313 | $27,000 | $3,294 | $23,706 |
| 2024 | $6,313 | $22,152 | $3,500 | $18,652 |
| 2023 | $5,987 | $22,152 | $3,500 | $18,652 |
| 2022 | $5,987 | $22,152 | $3,500 | $18,652 |
| 2021 | $6,567 | $17,724 | $4,220 | $13,504 |
| 2020 | $6,396 | $17,724 | $4,220 | $13,504 |
| 2019 | $5,329 | $19,694 | $4,220 | $15,474 |
| 2018 | $5,023 | $17,199 | $3,654 | $13,545 |
| 2017 | $4,942 | $17,199 | $3,654 | $13,545 |
| 2016 | $4,905 | $17,199 | $3,654 | $13,545 |
| 2015 | $4,897 | $16,366 | $3,191 | $13,175 |
| 2014 | $4,796 | $16,366 | $3,191 | $13,175 |
| 2013 | $4,408 | $16,366 | $3,191 | $13,175 |
Source: Public Records
Map
Nearby Homes
- 325 Shadowbend Dr Unit 3B
- 302 Linden Ln
- 272 Prairie View Ln
- 274 Prairie View Ln
- 190 N Milwaukee Ave Unit 3604
- 100 Deborah Ln Unit 16A
- 127 N Wolf Rd Unit 60A
- 28 Legacy Ln
- 21 Northfield Terrace Unit 21
- 115 E Dundee Rd Unit 3N
- 121 Commons Ct Unit 21
- 62 Mayer Ave
- 429 6th St
- 241 S Milwaukee Ave
- 45 Prairie Park Dr Unit 501
- 40 Prairie Park Dr Unit 707
- 195 7th St
- 367 Park Ave
- 10 Linden Ave
- 232 Arrowwood Dr
- 311 Shadow Bend Dr
- 309 Shadowbend Dr Unit 3B
- 307 Shadowbend Dr Unit 3C
- 313 Shadowbend Dr Unit 3B
- 305 Shadowbend Dr Unit 3C
- 315 Shadowbend Dr
- 303 Shadowbend Dr Unit 3A
- 303 Shadowbend Dr Unit 3
- 317 Shadowbend Dr Unit 3B
- 319 Shadowbend Dr Unit 3B
- 319 Krause Ln
- 306 Shadowbend Dr Unit 3A
- 304 Shadowbend Dr
- 321 Shadowbend Dr Unit 3B
- 302 Shadowbend Dr Unit 3C
- 301 Shadowbend Dr Unit 3A
- 323 Shadowbend Dr
- 300 Shadowbend Dr Unit 3
- 321 Krause Ln
- 305 Oakwood Ln
Your Personal Tour Guide
Ask me questions while you tour the home.