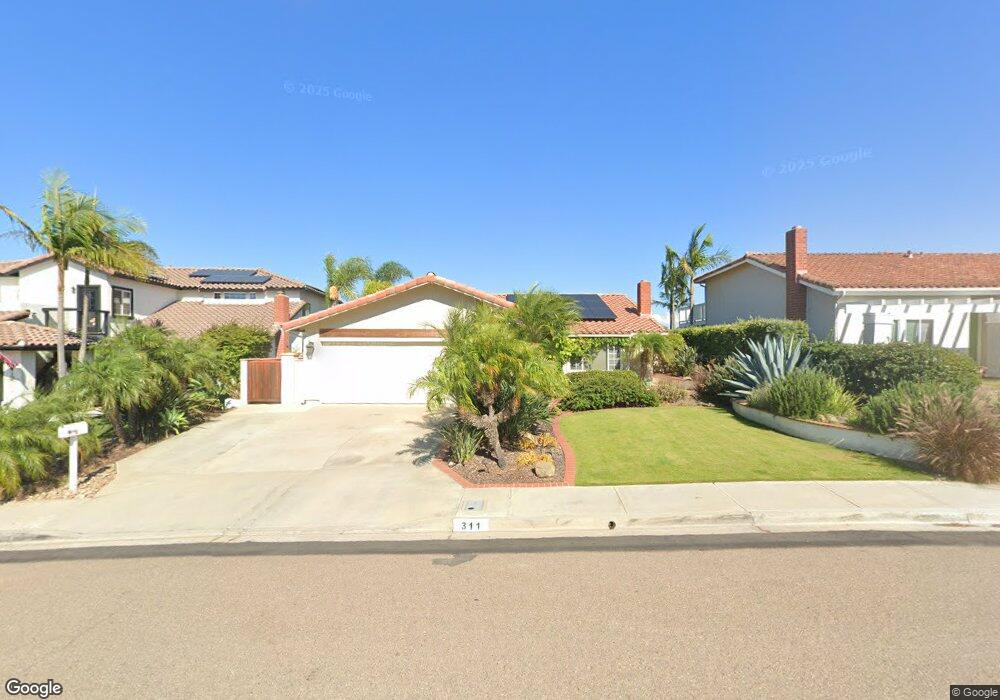
311 Sierra Ridge Dr Encinitas, CA 92024
Central Encinitas NeighborhoodEstimated Value: $1,592,000 - $1,772,000
4
Beds
2
Baths
1,799
Sq Ft
$958/Sq Ft
Est. Value
About This Home
This home is located at 311 Sierra Ridge Dr, Encinitas, CA 92024 and is currently estimated at $1,724,090, approximately $958 per square foot. 311 Sierra Ridge Dr is a home located in San Diego County with nearby schools including Park Dale Lane Elementary, Diegueno Middle School, and La Costa Canyon High School.
Ownership History
Date
Name
Owned For
Owner Type
Purchase Details
Closed on
Feb 2, 2000
Sold by
Costantino Gary & Colleen Family Trust
Bought by
Chang Benjamin I and Vensand Kristine A
Current Estimated Value
Home Financials for this Owner
Home Financials are based on the most recent Mortgage that was taken out on this home.
Original Mortgage
$308,000
Interest Rate
7.96%
Mortgage Type
Balloon
Purchase Details
Closed on
Jun 15, 1998
Sold by
Gary Costantino
Bought by
Costantino Gary E and Costantino Colleen A
Purchase Details
Closed on
Sep 4, 1996
Sold by
Gary Costantino
Bought by
Costantino Gary and Costantino Coleen
Purchase Details
Closed on
Sep 8, 1993
Sold by
Costantino Gary and Constantino Gary
Bought by
Costantino Gary
Purchase Details
Closed on
Jun 2, 1993
Purchase Details
Closed on
Apr 24, 1987
Purchase Details
Closed on
Jul 11, 1983
Create a Home Valuation Report for This Property
The Home Valuation Report is an in-depth analysis detailing your home's value as well as a comparison with similar homes in the area
Home Values in the Area
Average Home Value in this Area
Purchase History
| Date | Buyer | Sale Price | Title Company |
|---|---|---|---|
| Chang Benjamin I | $386,000 | Fidelity National Title Co | |
| Costantino Gary E | -- | -- | |
| Costantino Gary | -- | South Coast Title Company | |
| Costantino Gary | -- | -- | |
| -- | $245,000 | -- | |
| -- | $165,000 | -- | |
| -- | $140,000 | -- |
Source: Public Records
Mortgage History
| Date | Status | Borrower | Loan Amount |
|---|---|---|---|
| Closed | Chang Benjamin I | $308,000 |
Source: Public Records
Tax History Compared to Growth
Tax History
| Year | Tax Paid | Tax Assessment Tax Assessment Total Assessment is a certain percentage of the fair market value that is determined by local assessors to be the total taxable value of land and additions on the property. | Land | Improvement |
|---|---|---|---|---|
| 2025 | $6,745 | $593,245 | $305,614 | $287,631 |
| 2024 | $6,745 | $581,614 | $299,622 | $281,992 |
| 2023 | $6,543 | $570,211 | $293,748 | $276,463 |
| 2022 | $6,379 | $559,032 | $287,989 | $271,043 |
| 2021 | $6,265 | $548,072 | $282,343 | $265,729 |
| 2020 | $6,158 | $542,453 | $279,448 | $263,005 |
| 2019 | $6,037 | $531,818 | $273,969 | $257,849 |
| 2018 | $5,937 | $521,392 | $268,598 | $252,794 |
| 2017 | $5,835 | $511,170 | $263,332 | $247,838 |
| 2016 | $5,659 | $501,148 | $258,169 | $242,979 |
| 2015 | $5,553 | $493,622 | $254,292 | $239,330 |
| 2014 | $5,420 | $483,953 | $249,311 | $234,642 |
Source: Public Records
Map
Nearby Homes
- 2005 Countrywood Ct
- 155 Countrywood Ln
- 339 Rancho Santa fe Rd
- 277 Via Del Cerrito
- 1824 Eastwood Ln
- 612 Lucylle Ln
- 1838 Stonebrook Ln
- 1741 Charleston Ln
- 1926 Springdale Ln
- 1829 Forestdale Dr
- 710 Edelweiss Ln
- 1785 Caliban Dr
- 711 La Quebrada
- 220 S Shorehang Ln
- 1931 Hummock Ln
- 1716 Kellington Place
- 459 Flores de Oro
- 3736 38 Via Rancho Michelle
- 772 Conestoga Ct
- 1709 Edgefield Ln
- 315 Sierra Ridge Dr
- 319 Sierra Ridge Dr Unit 9
- 31 W 8th St
- 312 Sierra Ridge Dr
- 265 Sierra Ridge Dr
- 323 Sierra Ridge Dr
- 320 Sierra Ridge Dr
- 282 Sierra Ridge Dr
- 266 Sierra Ridge Dr
- 249 Sierra Ridge Dr
- 327 Sierra Ridge Dr
- 326 Sierra Ridge Dr
- 2116 Willowspring Place
- 303 Trailview Rd
- 250 Sierra Ridge Dr
- 233 Sierra Ridge Dr
- 2117 Willowspring Place
- 332 Sierra Ridge Dr Unit 9
- 234 Sierra Ridge Dr
- 263 Sierra Ridge Dr