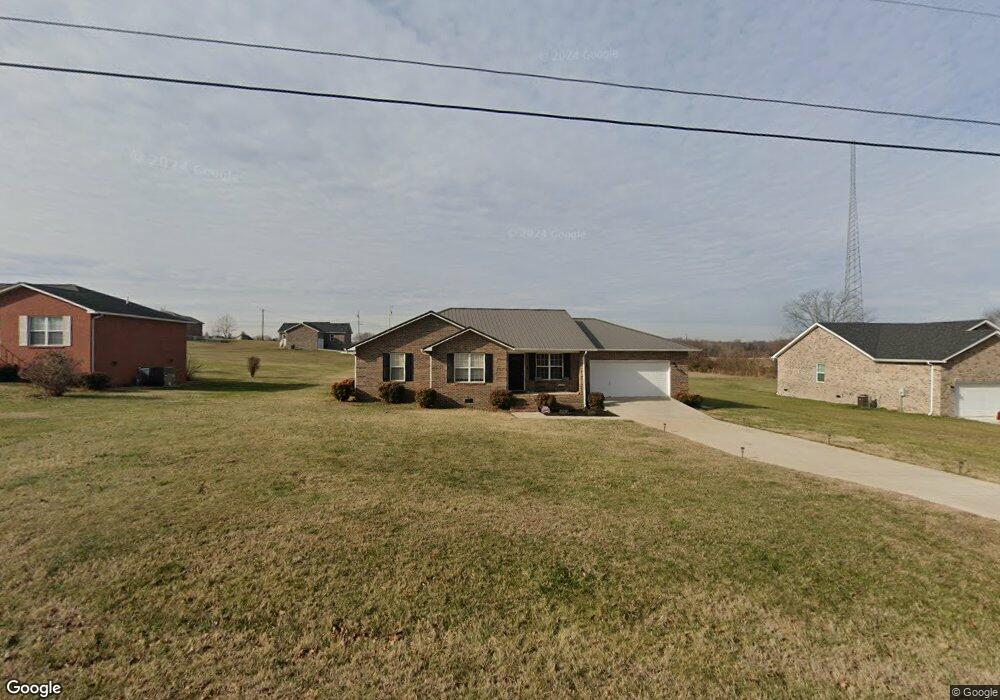
311 Susie Dr Winchester, TN 37398
Estimated Value: $287,430 - $325,000
--
Bed
2
Baths
1,539
Sq Ft
$201/Sq Ft
Est. Value
About This Home
This home is located at 311 Susie Dr, Winchester, TN 37398 and is currently estimated at $310,108, approximately $201 per square foot. 311 Susie Dr is a home located in Franklin County with nearby schools including South Middle School, Franklin County High School, and Winchester Christian Academy.
Ownership History
Date
Name
Owned For
Owner Type
Purchase Details
Closed on
Sep 6, 2019
Sold by
Collins Isaac N
Bought by
Metcalf Kelsey Laine and Collins Kelsey L
Current Estimated Value
Purchase Details
Closed on
Apr 28, 2016
Sold by
Wiseman James
Bought by
Collins Isaac N and Collins Kelsey L
Home Financials for this Owner
Home Financials are based on the most recent Mortgage that was taken out on this home.
Original Mortgage
$116,000
Outstanding Balance
$95,481
Interest Rate
4.75%
Estimated Equity
$214,627
Purchase Details
Closed on
Oct 25, 2002
Sold by
Burgess Family
Bought by
Wiseman James A
Home Financials for this Owner
Home Financials are based on the most recent Mortgage that was taken out on this home.
Original Mortgage
$84,390
Interest Rate
5.93%
Purchase Details
Closed on
Jul 3, 2001
Sold by
Manning Sue
Bought by
Manning Herlin
Purchase Details
Closed on
Jun 15, 1999
Bought by
The Burgess Fam Lim Parrn
Purchase Details
Closed on
Feb 25, 1991
Bought by
Manning Herlin and Manning Sue
Purchase Details
Closed on
May 22, 1990
Bought by
Manning Herlin
Create a Home Valuation Report for This Property
The Home Valuation Report is an in-depth analysis detailing your home's value as well as a comparison with similar homes in the area
Home Values in the Area
Average Home Value in this Area
Purchase History
| Date | Buyer | Sale Price | Title Company |
|---|---|---|---|
| Metcalf Kelsey Laine | -- | None Available | |
| Collins Isaac N | $125,000 | -- | |
| Wiseman James A | $87,000 | -- | |
| Manning Herlin | -- | -- | |
| The Burgess Fam Lim Parrn | $40,000 | -- | |
| Manning Herlin | -- | -- | |
| Manning Herlin | -- | -- |
Source: Public Records
Mortgage History
| Date | Status | Borrower | Loan Amount |
|---|---|---|---|
| Open | Collins Isaac N | $116,000 | |
| Previous Owner | Manning Herlin | $84,390 |
Source: Public Records
Tax History Compared to Growth
Tax History
| Year | Tax Paid | Tax Assessment Tax Assessment Total Assessment is a certain percentage of the fair market value that is determined by local assessors to be the total taxable value of land and additions on the property. | Land | Improvement |
|---|---|---|---|---|
| 2024 | $1,305 | $65,400 | $13,750 | $51,650 |
| 2023 | $1,305 | $65,400 | $13,750 | $51,650 |
| 2022 | $1,226 | $65,400 | $13,750 | $51,650 |
| 2021 | $1,025 | $65,400 | $13,750 | $51,650 |
| 2020 | $1,025 | $35,600 | $3,875 | $31,725 |
| 2019 | $1,025 | $35,600 | $3,875 | $31,725 |
| 2018 | $952 | $35,600 | $3,875 | $31,725 |
| 2017 | $952 | $35,600 | $3,875 | $31,725 |
| 2016 | $898 | $33,600 | $3,600 | $30,000 |
| 2015 | $898 | $33,600 | $3,600 | $30,000 |
| 2014 | $899 | $33,611 | $0 | $0 |
Source: Public Records
Map
Nearby Homes
- 218 Susie Dr
- 145 Susie Dr
- 0 Rowe Gap Rd
- 1533 Rowe Gap Rd
- 4025 David Crockett Pkwy W
- 6 Cypress Point Dr
- 1203 Liberty Rd
- 605 Strawberry Dr
- 1313 Liberty Rd
- 286 Strawberry Dr
- 379 Hooper Rd
- 17 Strawberry Dr
- 119 Kenmore Ave
- 412 Rotary Dr
- 805 S Shephard St
- 1111 Holders Cove Rd
- 816 S High St
- 136 Houghton Dr
- 73 Cypress Point Dr
- 905 S Jefferson St