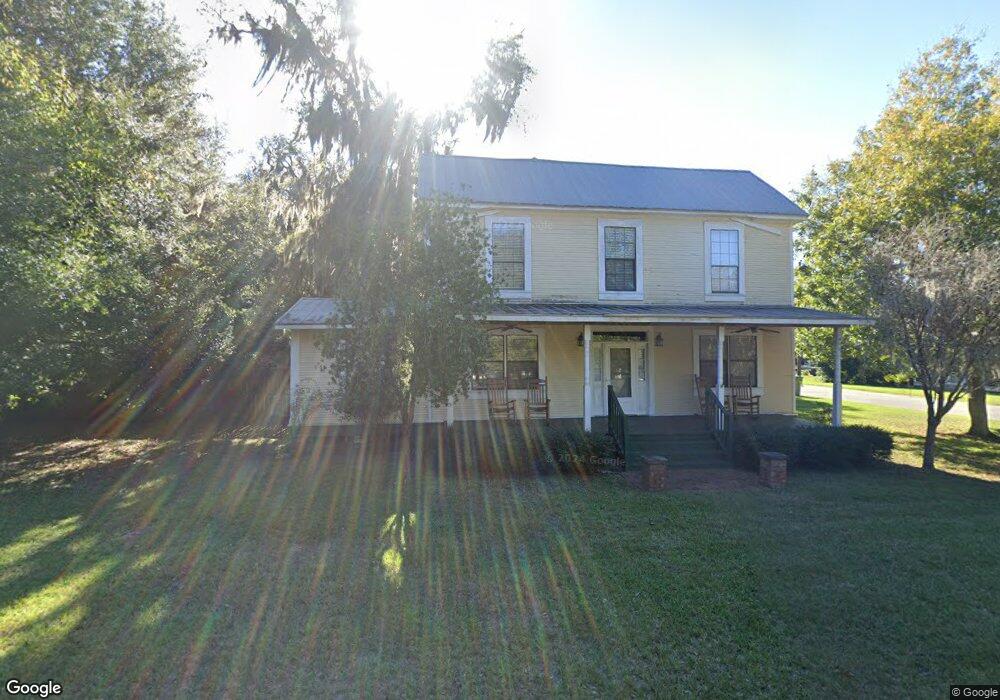
311 Third St W Darien, GA 31305
Estimated Value: $158,000 - $381,000
4
Beds
2
Baths
2,465
Sq Ft
$98/Sq Ft
Est. Value
About This Home
This home is located at 311 Third St W, Darien, GA 31305 and is currently estimated at $240,908, approximately $97 per square foot. 311 Third St W is a home located in McIntosh County with nearby schools including Todd Grant Elementary School, McIntosh County Middle School, and McIntosh County Academy.
Ownership History
Date
Name
Owned For
Owner Type
Purchase Details
Closed on
Sep 30, 2022
Sold by
Wilburn James R
Bought by
Mcintyre Patricia R
Current Estimated Value
Home Financials for this Owner
Home Financials are based on the most recent Mortgage that was taken out on this home.
Original Mortgage
$50,000
Interest Rate
5.66%
Mortgage Type
New Conventional
Purchase Details
Closed on
Oct 30, 2019
Sold by
Mursch Anne L
Bought by
Wilburn James R
Purchase Details
Closed on
Sep 17, 2019
Sold by
Mursch Russell T
Bought by
Mursch Anne L and Mursch Rev Tr
Purchase Details
Closed on
Dec 22, 2009
Sold by
Deutsche Bank National Trust Company
Bought by
Wilburn James R and Mursch Russell T
Purchase Details
Closed on
May 4, 2009
Sold by
Blake Frankie Lee Mr
Bought by
Dewtsche Bank National Trust Company
Purchase Details
Closed on
Apr 7, 2009
Sold by
Vanloan Frankie Lee and Blake Frank Lee
Bought by
Deutsche Bank National Trust Company
Purchase Details
Closed on
Dec 6, 2001
Sold by
Blake Frankie Lee Mr
Bought by
Blake Frankie Lee Mr
Create a Home Valuation Report for This Property
The Home Valuation Report is an in-depth analysis detailing your home's value as well as a comparison with similar homes in the area
Purchase History
| Date | Buyer | Sale Price | Title Company |
|---|---|---|---|
| Mcintyre Patricia R | $75,000 | -- | |
| Wilburn James R | $63,500 | -- | |
| Mursch Anne L | -- | -- | |
| Wilburn James R | $60,000 | -- | |
| Dewtsche Bank National Trust Company | -- | -- | |
| Deutsche Bank National Trust Company | $179,551 | -- | |
| Blake Frankie Lee Mr | -- | -- |
Source: Public Records
Mortgage History
| Date | Status | Borrower | Loan Amount |
|---|---|---|---|
| Closed | Mcintyre Patricia R | $50,000 |
Source: Public Records
Tax History
| Year | Tax Paid | Tax Assessment Tax Assessment Total Assessment is a certain percentage of the fair market value that is determined by local assessors to be the total taxable value of land and additions on the property. | Land | Improvement |
|---|---|---|---|---|
| 2024 | $2,769 | $74,200 | $26,760 | $47,440 |
| 2023 | $2,646 | $70,520 | $23,400 | $47,120 |
| 2022 | $1,912 | $63,200 | $23,400 | $39,800 |
| 2021 | $1,678 | $54,800 | $23,400 | $31,400 |
| 2020 | $1,685 | $54,400 | $23,400 | $31,000 |
| 2019 | $1,890 | $65,400 | $23,400 | $42,000 |
| 2018 | $1,986 | $65,400 | $23,400 | $42,000 |
| 2017 | $1,626 | $55,440 | $15,040 | $40,400 |
| 2016 | $1,291 | $50,400 | $10,000 | $40,400 |
| 2015 | $1,072 | $35,432 | $10,500 | $24,932 |
| 2014 | $1,074 | $35,432 | $10,500 | $24,932 |
Source: Public Records
Map
Nearby Homes
- None Jackson St
- 503 Sixth St W
- 0 Marsh Hen Trail Unit 1659095
- 801 Jackson St
- vacant 8th St W
- n/a 8th St W
- 0 Georgia 99 Unit 1648162
- 0 Georgia 99 Unit 1647831
- 91 Screven St Unit 110
- 91 Screven St Unit Bldg D Unit 309
- Tract B 38 Acres
- 107 Broad St Unit D
- 105 Broad Unit C St
- 902 Old River Rd
- Lot 4 Fort King George
- Lot 3 Fort King George
- 211 Trumbull St
- 1005 Elbert St
- 227 Fort King George Dr Unit K
- 1015 Elbert St
- 311 3rd St W
- 307 Third St W
- 307 Third St W
- 304 Second St W
- 305 Clarke St
- 303 Third St W
- 302 Second St W
- 302 2nd St W
- 302 Second St W
- 307 Clarke St
- 402 2nd St W
- 307 Jackson St
- 308 Third St W
- 404 Third St W
- 0 2nd St W Unit 1601569
- 0 2nd St W Unit 1604457
- W 2nd St W
- 309 Fourth St W
- 304 2nd St W
- 306 Elbert St
Your Personal Tour Guide
Ask me questions while you tour the home.