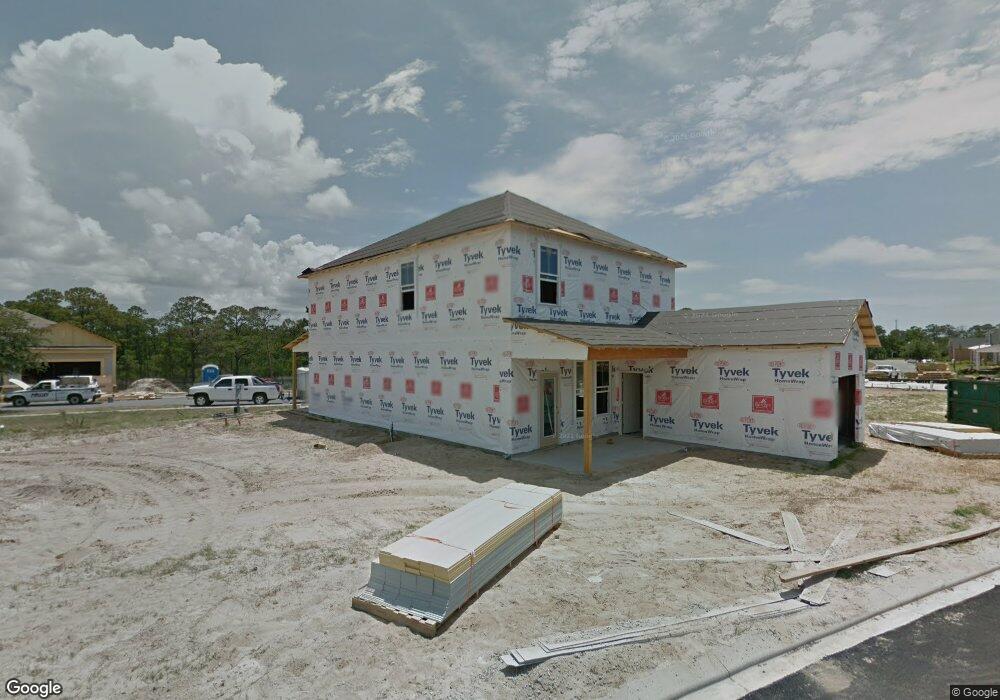
311 Turtle Cove Unit 28 Panama City Beach, FL 32413
Estimated Value: $518,000 - $606,000
4
Beds
3
Baths
2,248
Sq Ft
$242/Sq Ft
Est. Value
About This Home
This home is located at 311 Turtle Cove Unit 28, Panama City Beach, FL 32413 and is currently estimated at $543,605, approximately $241 per square foot. 311 Turtle Cove Unit 28 is a home located in Bay County with nearby schools including Surfside Middle School, J.R. Arnold High School, and West Bay Elementary School.
Ownership History
Date
Name
Owned For
Owner Type
Purchase Details
Closed on
Feb 15, 2022
Sold by
Arosemena Elena M
Bought by
Matthews Amy Lee
Current Estimated Value
Purchase Details
Closed on
Jul 15, 2015
Sold by
Girdler John B and Girdler Olivia J
Bought by
Hornbeak Deborah L
Home Financials for this Owner
Home Financials are based on the most recent Mortgage that was taken out on this home.
Original Mortgage
$180,000
Interest Rate
3.92%
Mortgage Type
New Conventional
Purchase Details
Closed on
Sep 14, 2011
Sold by
Beazer Homes Corp
Bought by
Girdler John B and Girdler Olivia J
Home Financials for this Owner
Home Financials are based on the most recent Mortgage that was taken out on this home.
Original Mortgage
$191,992
Interest Rate
4.4%
Mortgage Type
New Conventional
Create a Home Valuation Report for This Property
The Home Valuation Report is an in-depth analysis detailing your home's value as well as a comparison with similar homes in the area
Home Values in the Area
Average Home Value in this Area
Purchase History
| Date | Buyer | Sale Price | Title Company |
|---|---|---|---|
| Matthews Amy Lee | $485,000 | New Title Company Name | |
| Hornbeak Deborah L | $330,000 | None Available | |
| Girdler John B | $240,000 | First American Title Insuran |
Source: Public Records
Mortgage History
| Date | Status | Borrower | Loan Amount |
|---|---|---|---|
| Previous Owner | Hornbeak Deborah L | $180,000 | |
| Previous Owner | Girdler John B | $191,992 |
Source: Public Records
Tax History Compared to Growth
Tax History
| Year | Tax Paid | Tax Assessment Tax Assessment Total Assessment is a certain percentage of the fair market value that is determined by local assessors to be the total taxable value of land and additions on the property. | Land | Improvement |
|---|---|---|---|---|
| 2024 | $5,308 | $435,830 | $69,797 | $366,033 |
| 2023 | $5,308 | $429,137 | $59,086 | $370,051 |
| 2022 | $4,228 | $370,834 | $62,814 | $308,020 |
| 2021 | $3,083 | $282,387 | $0 | $0 |
| 2020 | $2,944 | $278,488 | $0 | $0 |
| 2019 | $2,906 | $272,227 | $45,263 | $226,964 |
| 2018 | $2,932 | $270,098 | $0 | $0 |
| 2017 | $2,679 | $267,427 | $0 | $0 |
| 2016 | $3,070 | $264,738 | $0 | $0 |
| 2015 | $1,304 | $142,564 | $0 | $0 |
| 2014 | $1,288 | $141,433 | $0 | $0 |
Source: Public Records
Map
Nearby Homes
- 328 Turtle Cove
- 314 Turtle Cove
- 310 Terrapin Way
- 306 Turtle Cove
- 212 Turtle Cove
- 114 Turtle Cove
- 102 Turtle Cove
- 109 Turtle Cove
- 749 Westwood Beach Cir
- 21926 Lakeview Dr
- 21818 Kelly Pines Place
- 5 Blue Crab Ln
- 21902 Sunnyside Ln
- 21726 Marlin Ave
- 21905 Sunnyside Ln
- 21810 Marlin Ave
- 734 Gainous Rd
- 627 Gainous Rd
- 21825 Marlin Ave
- 0 Kelly St Unit 768087
- 311 Turtle Cove
- 313 Turtle Cove
- 309 Turtle Cove
- LOT 29 Lot 29 Turtle Cove
- 307 Turtle Cove
- 26 Turtle Cove
- 315 Turtle Cove
- 305 Turtle Cove
- 312 Terrapin Way Unit LOT 34
- 312 Terrapin Way
- 317 Turtle Cove Unit 25
- 312 Turtle Cove
- 316 Turtle Cove Unit L - 8
- 316 Turtle Cove
- 310 Terrapin Way Unit LOT 33
- 303 Turtle Cove
- 308 Terrapin Way Unit LOT 32
- 308 Terrapin Way
- 310 Turtle Cove
- 319 Turtle Cove