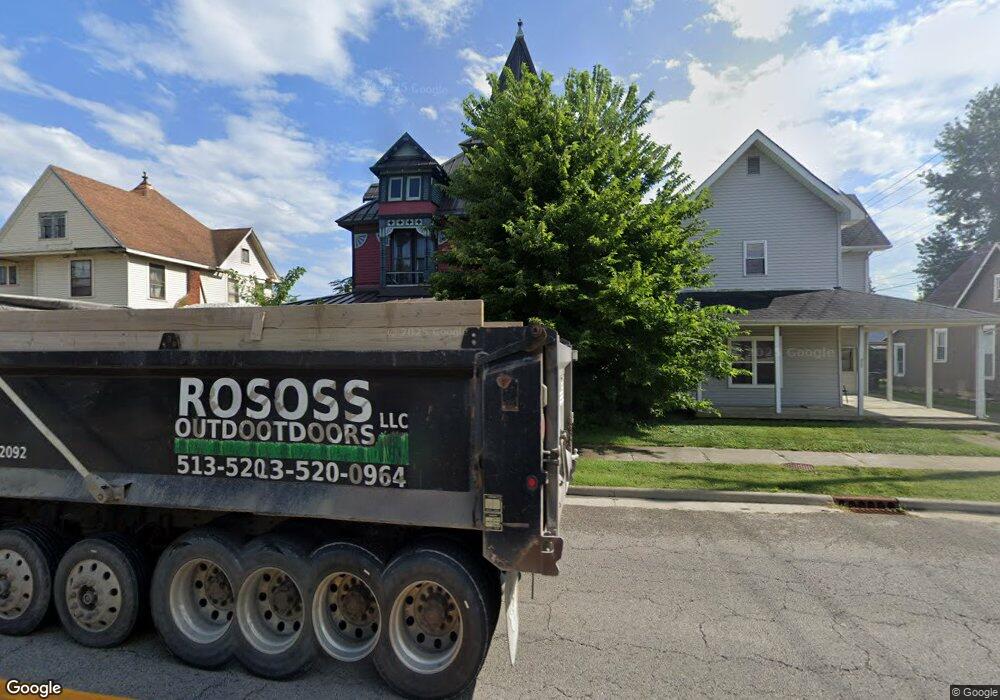
311 W 2nd St Rushville, IN 46173
Estimated Value: $186,000 - $216,000
4
Beds
2
Baths
2,770
Sq Ft
$73/Sq Ft
Est. Value
About This Home
This home is located at 311 W 2nd St, Rushville, IN 46173 and is currently estimated at $200,881, approximately $72 per square foot. 311 W 2nd St is a home located in Rush County with nearby schools including Rushville Consolidated High School and St. Mary Catholic School.
Ownership History
Date
Name
Owned For
Owner Type
Purchase Details
Closed on
Sep 29, 2009
Sold by
Lord Duncan Lora Lea and Lord Margo
Bought by
Pasilis Daniel
Current Estimated Value
Home Financials for this Owner
Home Financials are based on the most recent Mortgage that was taken out on this home.
Original Mortgage
$38,156
Outstanding Balance
$24,903
Interest Rate
5.07%
Mortgage Type
FHA
Estimated Equity
$175,978
Purchase Details
Closed on
Sep 24, 2009
Sold by
Lord Duncan Derek B
Bought by
Lord Duncan Lora Lea and Lord Margo
Home Financials for this Owner
Home Financials are based on the most recent Mortgage that was taken out on this home.
Original Mortgage
$38,156
Outstanding Balance
$24,903
Interest Rate
5.07%
Mortgage Type
FHA
Estimated Equity
$175,978
Create a Home Valuation Report for This Property
The Home Valuation Report is an in-depth analysis detailing your home's value as well as a comparison with similar homes in the area
Home Values in the Area
Average Home Value in this Area
Purchase History
| Date | Buyer | Sale Price | Title Company |
|---|---|---|---|
| Pasilis Daniel | -- | None Available | |
| Lord Duncan Lora Lea | -- | None Available |
Source: Public Records
Mortgage History
| Date | Status | Borrower | Loan Amount |
|---|---|---|---|
| Open | Pasilis Daniel | $38,156 |
Source: Public Records
Tax History Compared to Growth
Tax History
| Year | Tax Paid | Tax Assessment Tax Assessment Total Assessment is a certain percentage of the fair market value that is determined by local assessors to be the total taxable value of land and additions on the property. | Land | Improvement |
|---|---|---|---|---|
| 2024 | $1,897 | $189,700 | $11,700 | $178,000 |
| 2023 | $1,550 | $155,000 | $11,700 | $143,300 |
| 2022 | $1,434 | $143,400 | $11,700 | $131,700 |
| 2021 | $1,258 | $132,100 | $11,700 | $120,400 |
| 2020 | $1,026 | $125,200 | $11,100 | $114,100 |
| 2019 | $835 | $118,900 | $11,100 | $107,800 |
| 2018 | $667 | $113,100 | $6,400 | $106,700 |
| 2017 | $586 | $111,000 | $6,400 | $104,600 |
| 2016 | $490 | $107,800 | $6,400 | $101,400 |
| 2014 | $1,189 | $118,900 | $6,400 | $112,500 |
| 2013 | $1,189 | $118,900 | $6,400 | $112,500 |
Source: Public Records
Map
Nearby Homes